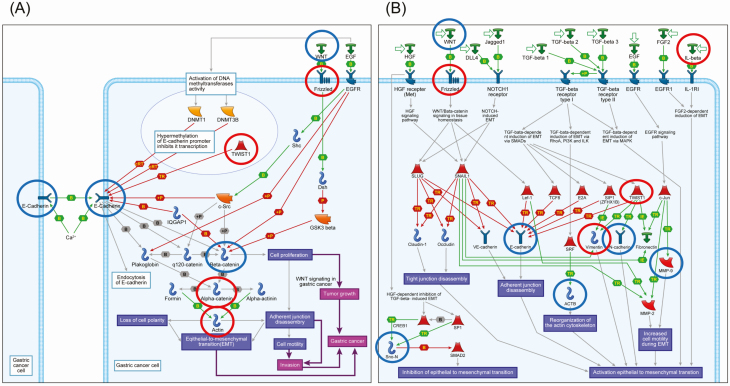
Figure 4.
Schematically illustrated representative pathway maps, ‘E-cadherin signaling and its regulation in gastric cancer (FDR = 0.004 and P < 0.001)’ (A) and ‘Development_Regulation of EMT (FDR = 0.002 and P < 0.001)’ (B), in which epigenomically and genomically affected genes were accumulated in Cluster B1, by MetaCore software. Original pathway maps generated by MetaCore software have been simplified by eliminating items that were not correlated with genes affected epigenetically and/or genetically in our Cluster B1. Genes showing DNA methylation alterations and those showing genetic aberrations (SNVs, insertions/deletions and/or copy number aberrations) are indicated in red and blue, respectively.

