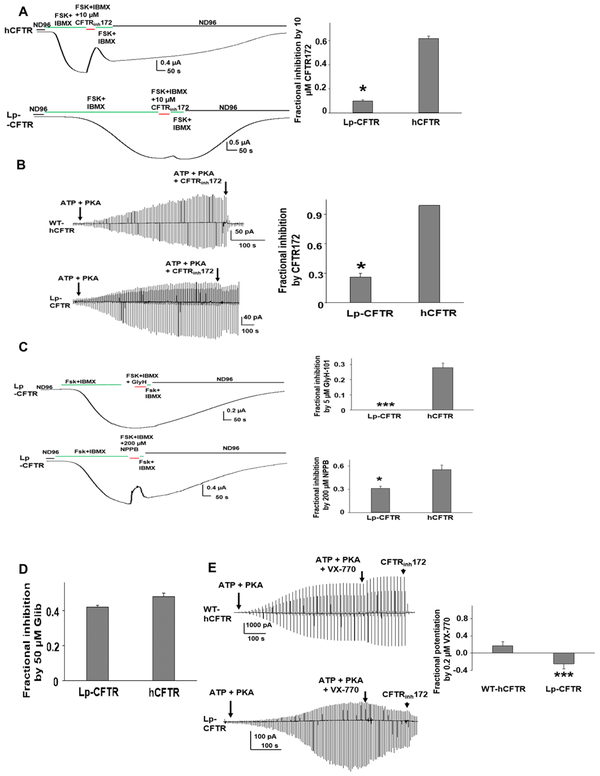
Figure 2: Lp-CFTR has limited chloride conduction and is poorly responsive to both CFTR potentiators and inhibitors.
A: Whole oocyte characterization of Lp-CFTR function. Like hCFTR, Lp-CFTR can be activated by 10 μM Forskolin (FSK) with 1 mM isobutylmethylxanthine (IBMX) but exhibits distinctly slower activation. CFTRinh172 significantly blocked hCFTR (upper panel), with markedly diminished effect on Lp-CFTR (lower panel). Summary data are shown (right panel), data shown as mean±SEM; *= p< 0.05 via unpaired t-test, n=10 for hCFTR; n=4 for Lp-CFTR.
B: Macropatch characterization of Lp-CFTR. Representative inside-out macropatch currents of hCFTR (upper panel) and Lp-CFTR (lower panel). Channels were activated by 127.6 U/mL PKA and 1 mM ATP until currents reached plateau. A voltage-ramp protocol was applied every 5 s. CFTR currents were blocked with 10 μM CFTRinh172. Summary data are shown in right panel, data shown as mean±SEM. *= p<0.05 compared to hCFTR via unpaired t-test; n=4 for each group.
C: Lp-CFTR is not inhibited by GlyH-101 and is poorly sensitive to NPPB. Lp-CFTR demonstrates reduced sensitivity to inhibition by the CFTR pore blockers GlyH-101 (GlyH, 5uM, upper panel) and NPPB (200 μM) in whole oocyte recordings. Summary data are shown in right panels, data shown as mean±SEM. *** P<0.001; * P<0.05 compared to hCFTR via unpaired t-test. n=4 for Lp-CFTR, n=7 for hCFTR.
D: Inhibition of Lp-CFTR by glibenclamide. Glibenclamide (50 μM) blocked hCFTR and Lp-CFTR to a similar extent in inside-out macropatches; no statistical difference between groups via unpaired t-test. Data shown as mean±SEM; n=6 for each group.
E: Lp-CFTR is insensitive to potentiation by VX-770. Representative currents of WT-hCFTR (top panel) and Lp-CFTR (bottom panel) were recorded in inside-out macropatches in presence of 1 mM ATP and 127.6 U/mL PKA with or without 0.2 μM VX-770. A voltage-ramp protocol was applied every 5 s. CFTR currents were blocked with 10 μM CFTRinh172. Summary data for fractional potentiation are shown in right panel (Fractional potentiation by VX-770 = (I(ATP + PKA + VX-770)/ I(ATP + PKA) −1), data shown as mean±SEM; n = 4 –7 each. ***, p < 0.001 compared to hCFTR via unpaired t-test.
See also Figure S2

