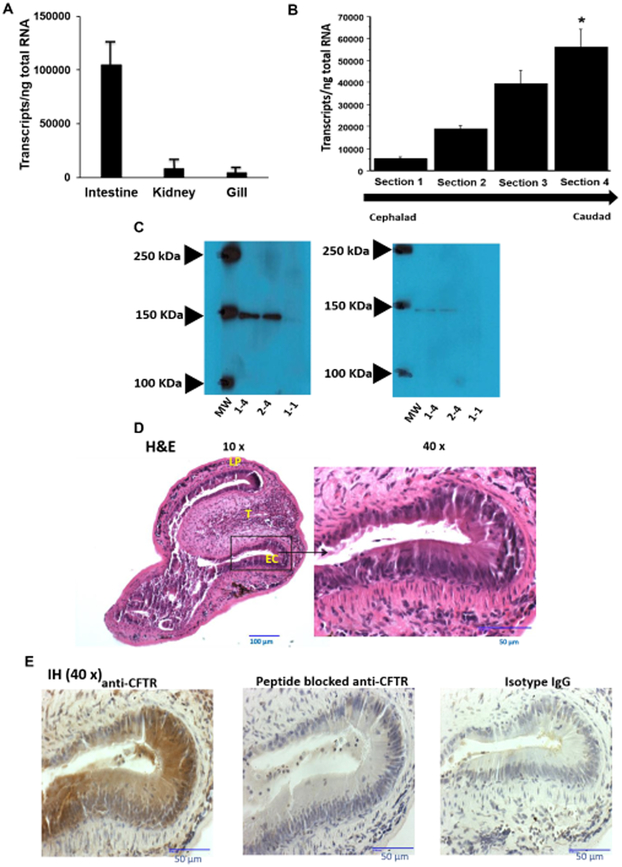
Figure 4: Lamprey CFTR is highly expressed in the distal gastrointestinal (GI) tract of the lamprey.
A: CFTR transcripts are found in various organs in the lamprey. RNA was isolated from intestine, kidney, and gill from seven different larval lampreys and quantified for Lp-CFTR via SYBR-green RT-qPCR (each lamprey organ run in triplicate), data shown as mean+SD; p<0.001 via ANOVA for all groups, p<0.001 for intestine vs. kidney and p<0.001 for intestine vs. gill via Tukey’s post-test. Of note, no difference was observed in 40S rRNA between tissues.
B: CFTR transcripts are increased in the distal GI tract. RNA was isolated from different sections of the GI tract (cephalad (Section 1) to caudad (Section 4)) from 7 different larval lamprey and quantified for Lp-CFTR via SYBR-green RT-qPCR (each lamprey section run in triplicate), data shown as mean+SD. p<0.01 via ANOVA for all groups, * p<0.01 Section 4 vs. Section 1 via Tukey’s post-test. Of note, no difference was observed in 40S rRNA between sections.
C: CFTR expression in lamprey GI tract. Representative Western blot (from six separate lampreys) with rabbit anti-lamprey CFTR antibody. Blot of Section 4 GI tract tissue from two separate lampreys (numbers 1-4 and 2-4), and a representative GI tract tissue of the Section 1 of a lamprey (number 1-1), demonstrating predicted ~150 kDa band at higher density in Section 4 vs. Section 1 (left panel). Antibody depletion with competing peptide demonstrating loss of 150 kDa band in all samples (right panel).
D Transverse section of lamprey GI tract. Image of the caudal section (Section 4) representative of four separate lampreys. Lampreys were dissected transversally and stained with H&E. At 10x magnification, the lamina propria (LP) and typhosole (T) were identified with lining epithelial cells (EC). At 40x, the ECs exhibit features of simple columnar epithelium with darkly stained nuclei and brush border.
E: CFTR is expressed in lamprey GI tract. Image of the caudal region of the intestine (Section 4) representative of images from four separate lampreys. Lampreys were dissected transversely and stained with either anti-CFTR antibody (1:3000 dilution), isotype control IgG (1:3000 dilution), or peptide blocked anti-CFTR antibody (1:3000 dilution), and imaged at 40x over a region of epithelial cells. Of note, there is significant Lp-CFTR staining of intestinal epithelia that is greatly reduced with peptide block and not observed with isotype IgG control.

