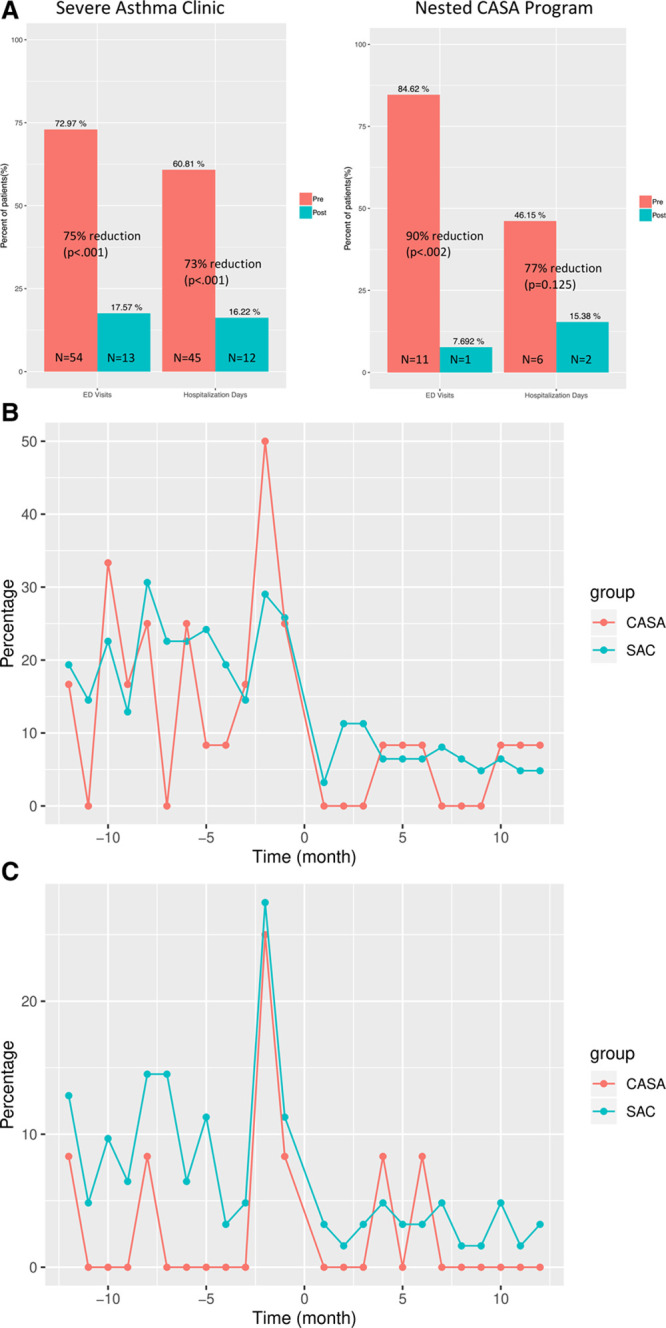
Fig. 2.

Comparison of healthcare utilization before and after intervention. A, Pre- and postchanges in ED visits (2 or more) and hospitalization days (2 or more) of subjects in SAC (N = 74) and the subset who participated in the CASA program (N = 12). Both pre- and postrecord contains each patient’s visits/hospitalization days for 12 months. B, P-chart of pre- and postintervention changes in the percentage of subjects in SAC and the CASA program who had ED visits over the 12 months before and after the intervention. C, P-chart of pre- and postintervention changes in the percentage of subjects in SAC and the CASA program who had hospitalization days over the 12 months before and after the intervention.
