
Figure 3.
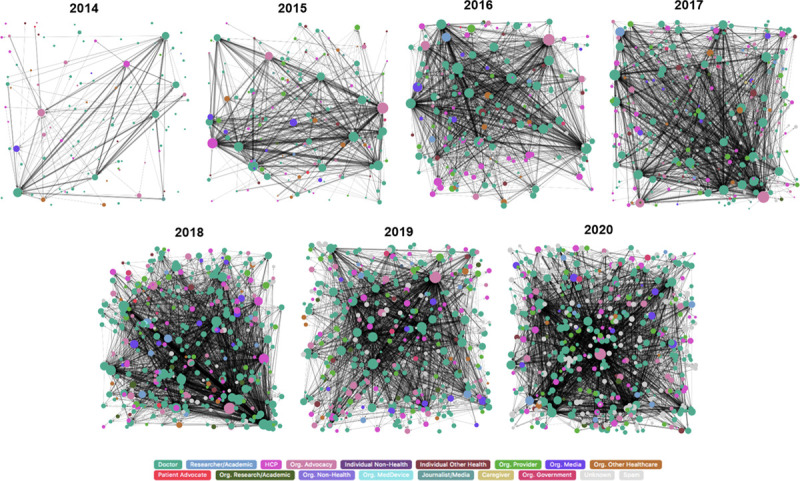
Network analysis by year. Network analysis of users tweeting with the Congress hashtag. The size and density of a node proportionally reflect the average amount of time a participant/user spends in conversation, and the arrows reflect the conversational connections between the nodes.