
FIGURE 1.
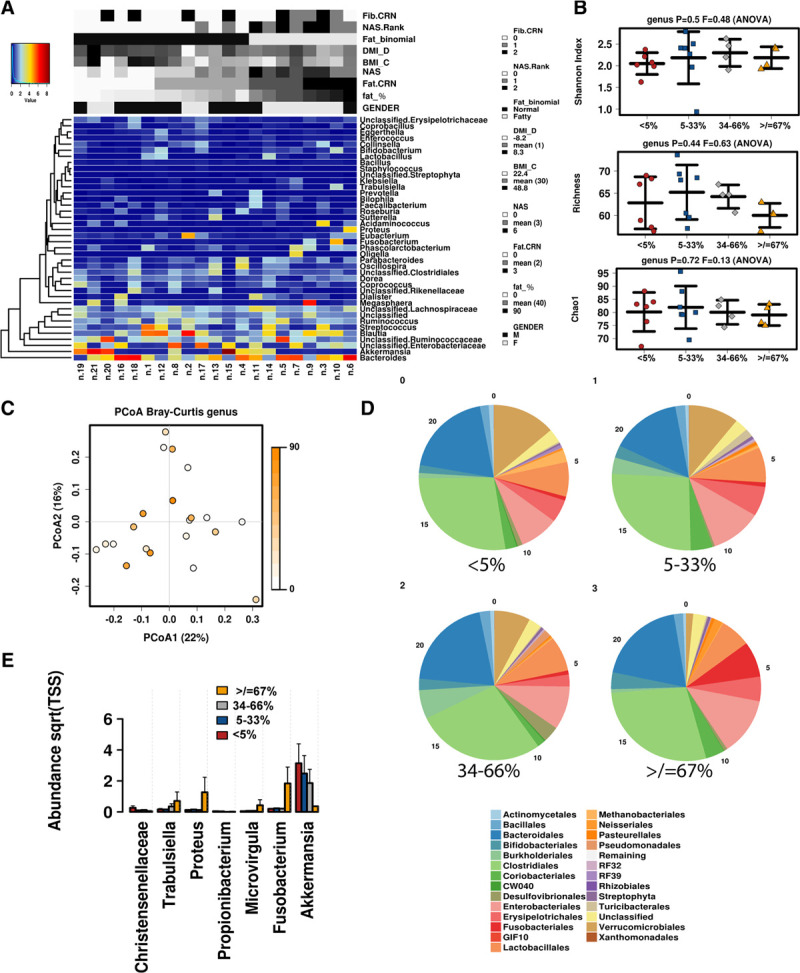
Microbiome associated with steatosis scores. A, Heatmap of the most abundant taxa detected by metagenomics is displayed with associated biopsy metadata. B, Alpha diversity determined by Shannon Index, Richness, and Chao1. C, Principal component analysis based on the associated biopsy fat percentage. D, Relative abundance of taxa at the order level by degree of steatosis. E, Abundance of select genera displayed by steatosis groups.