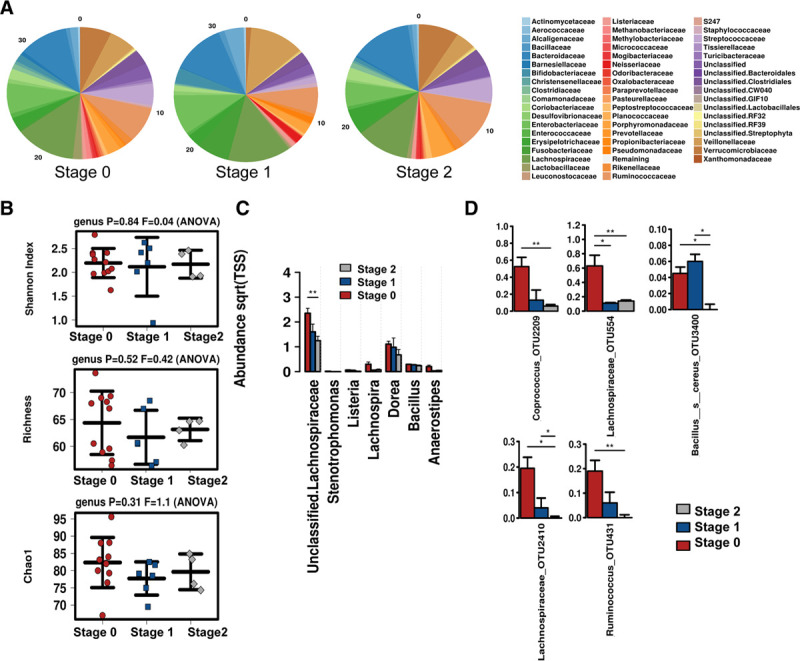
FIGURE 4.

Microbiome associated with degree of biopsy Fibrosis stage. A, Relative abundance of the microbial communities at the family level. B, Alpha diversity shown by Shannon Index, Richness, and Chao1. C, Differentially abundant taxa at the family and genus and (D) significantly altered OTUs across fibrosis stages.
