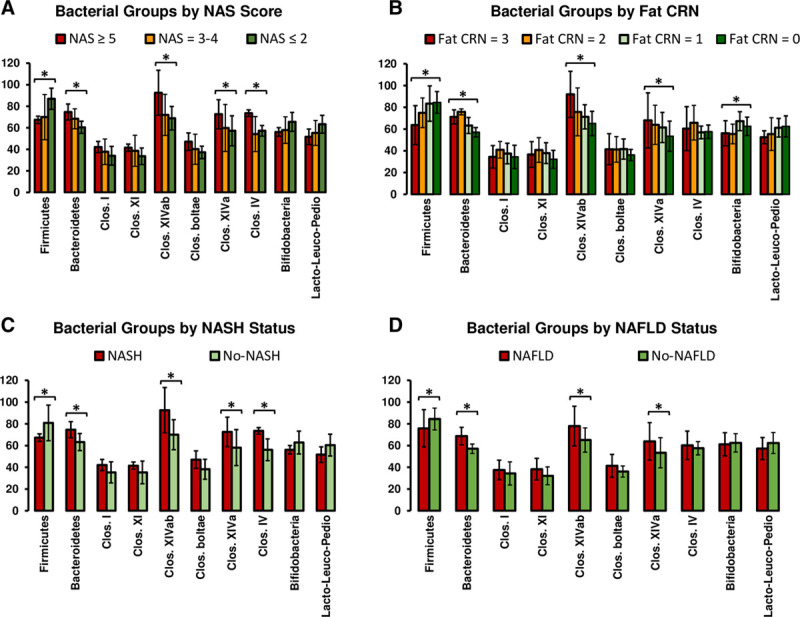
FIGURE 5.

Relative abundance of fecal bacteria of liver transplant recipients. The stool samples were analyzed by qPCR. The results depict relative abundance of target bacteria normalized by universal 16S rRNA gene abundance representing all bacteria in a sample. Values are presented as mean ± SD of 2 experiments done in duplicates. Columns; mean; bars, SD. Columns with (*) indicate significantly different (P = 0.05) relative abundance values. CRN, clinical research network; NAFLD, nonalcoholic fatty liver disease; NAS, NAFLD activity score; NASH, nonalcoholic steatohepatitis; qPCR, quantitative PCR.
