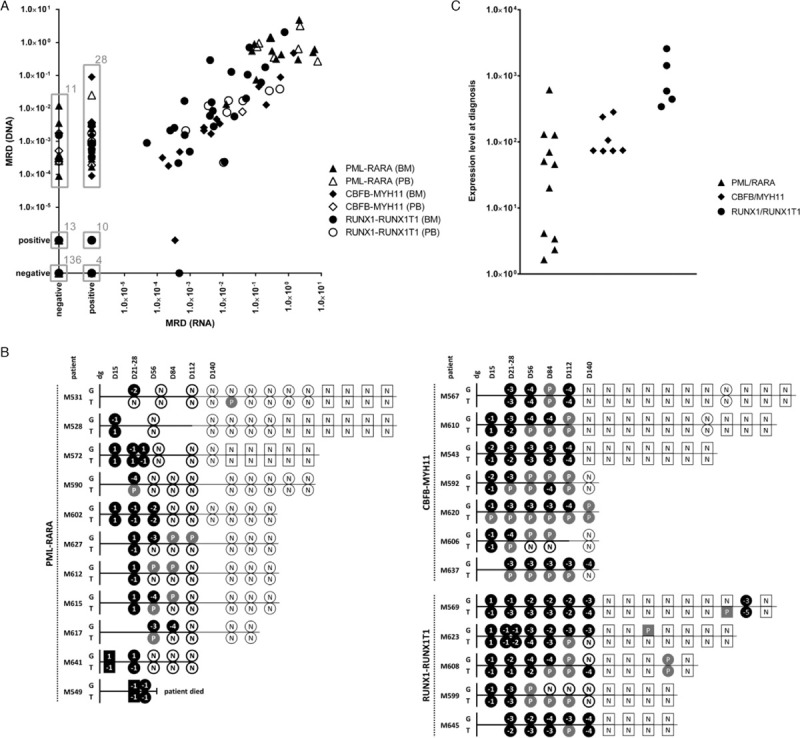
Figure 1.

Results of minimal residual disease monitoring and diagnostic levels of fusion transcripts. (A) Comparison of minimal residual disease (MRD) levels in 265 follow-up samples of patients harboring the PML-RARA (triangle), CBFB-MYH11 (diamond) and RUNX1-RUNX1T1 (circle) fusions measured by the FG-based approach (DNA) versus by the FT-approach (RNA). Grey boxes surround specific clusters of samples whose counts are indicated by the numbers at top right corners. (B) Schematic representation of MRD levels in individual patients harboring the PML-RARA, CBFB-MYH11 and RUNX1-RUNX1T1 fusions during their treatment courses as assessed by the FG-based approach (G) versus by the FT-based approach (T). Bone marrow (BM) samples are shown as circles, peripheral blood (PB) samples as squares. If paired BM and PB samples were analyzed at the particular time-point, only BM is shown. MRD levels ≥0.5 are coded as “1”, < 0.5 – ≥0.05 as “−1”, < 0.05 – ≥0.005 as “−2”, < 0.005 – ≥0.0005 as “−3”, < 0.0005 – ≥0.00005 as “−4”, < 0.00005 as “−5”. All samples with quantifiably positive MRD levels are shown as black symbols, samples with non-quantifiably positive and negative MRD levels are shown as grey symbols with “P” code and white symbols with “N” code, respectively. Bold versus thin symbol borders and time-lines represent intensive versus maintenance treatment phases. Time course in days (D) is shown at the top of scheme. dg = diagnosis; positive – non-quantifiably positive. (C) Fusion transcript expression levels (number of fusion transcript copies per 1000 copies of GUS) at diagnosis in patients with PML-RARA (n = 11), CBFB-MYH11 (n = 7) and RUNX1-RUNX1T1 (n = 5).
