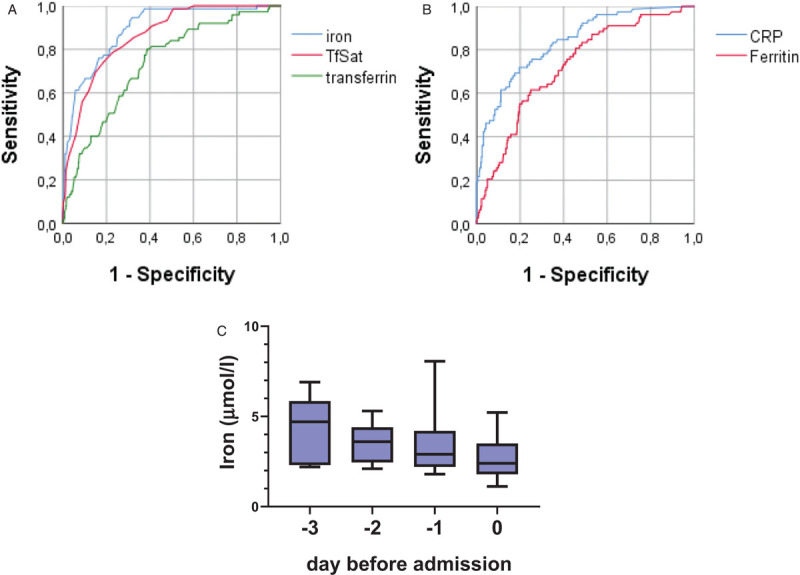
Figure 1.

A: ROC curve for cohort A and B for predicting hospitalization for iron, transferrin and TfSat with AUCs of 0.894, 0.735, and 0.863, respectively (and confidence intervals of 0.858–0.931, 0.676–0.795, and 0.824–0.903, respectively). B: ROC curve for cohort A and B for predicting hospitalization for ferritin and CRP with AUCs of 0.725 (CI 0.667–0.784), and 0.838 (CI 0.790–0.886), respectively. C: Course of iron pre-hospitalization for cohort C. Data are presented as boxplot (median ± interquartile range).
