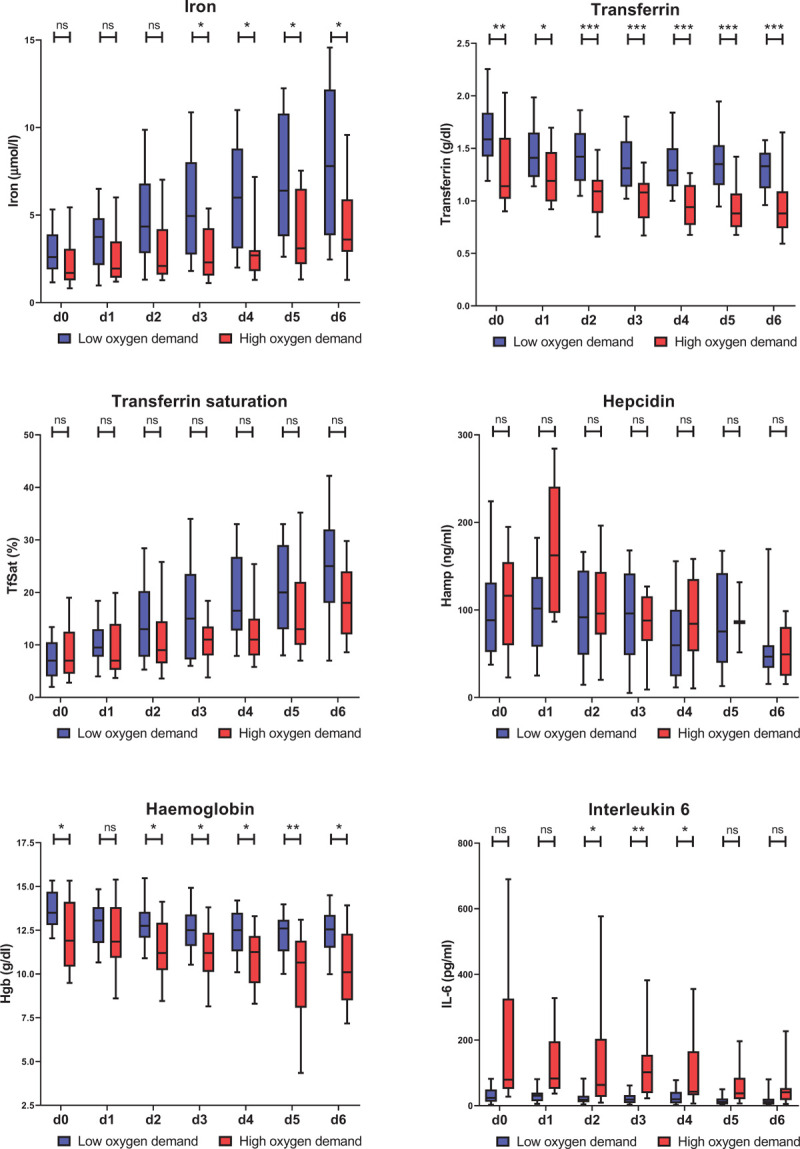
Figure 2.

Course of iron and inflammatory parameters in inpatients during the disease course. Serum iron, transferrin, transferrin saturation, hepcidin, hemoglobin (Hgb), and IL-6 have been measured at the time of admission (d0) and for 6 following days (d1-d6). Box and whiskers plot represent median with 25th and 75th percentiles (boxes) together with 10th and 90th percentiles (whiskers). Statistical analysis was performed with the Mann-Whitney U test and the p value has been corrected for multiple comparisons with the Holm method. ns = not significant; ∗p < 0.05; ∗∗p < 0.01; ∗∗∗p < 0.001; ∗∗∗∗p < 0.0001.
