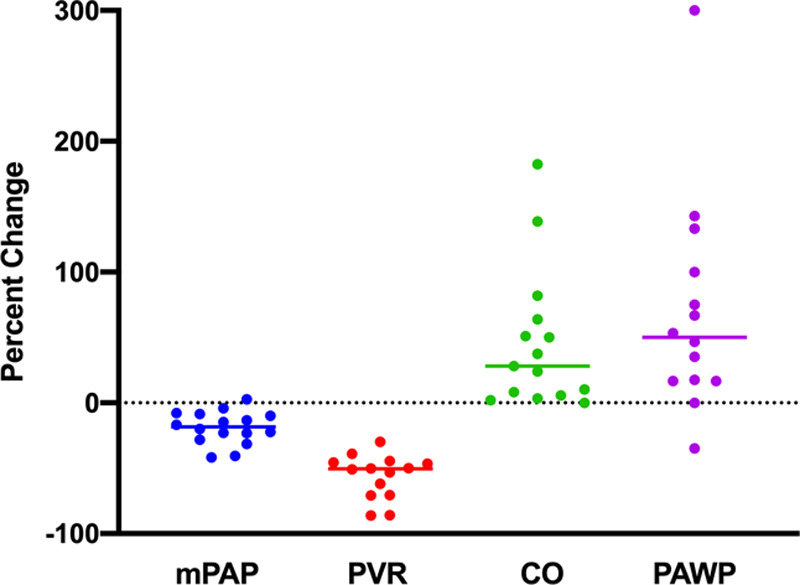
FIGURE 1.

Percent change in pulmonary hemodynamics after treatment with pulmonary arterial hypertension targeted therapy. Percent changes in mPAP, PVR, CO, and PAWP from baseline after treatment with pulmonary arterial hypertension targeted therapy are shown. PAH therapy resulted in a mild reduction in mPAP with a moderate reduction in PVR and an increase in both CO and PAWP. Lines represent the median percent change. CO, cardiac output; mPAP, mean pulmonary arterial pressure; PAH, pulmonary arterial hypertension; PAWP, pulmonary artery wedge pressure; PVR, pulmonary vascular resistance.
