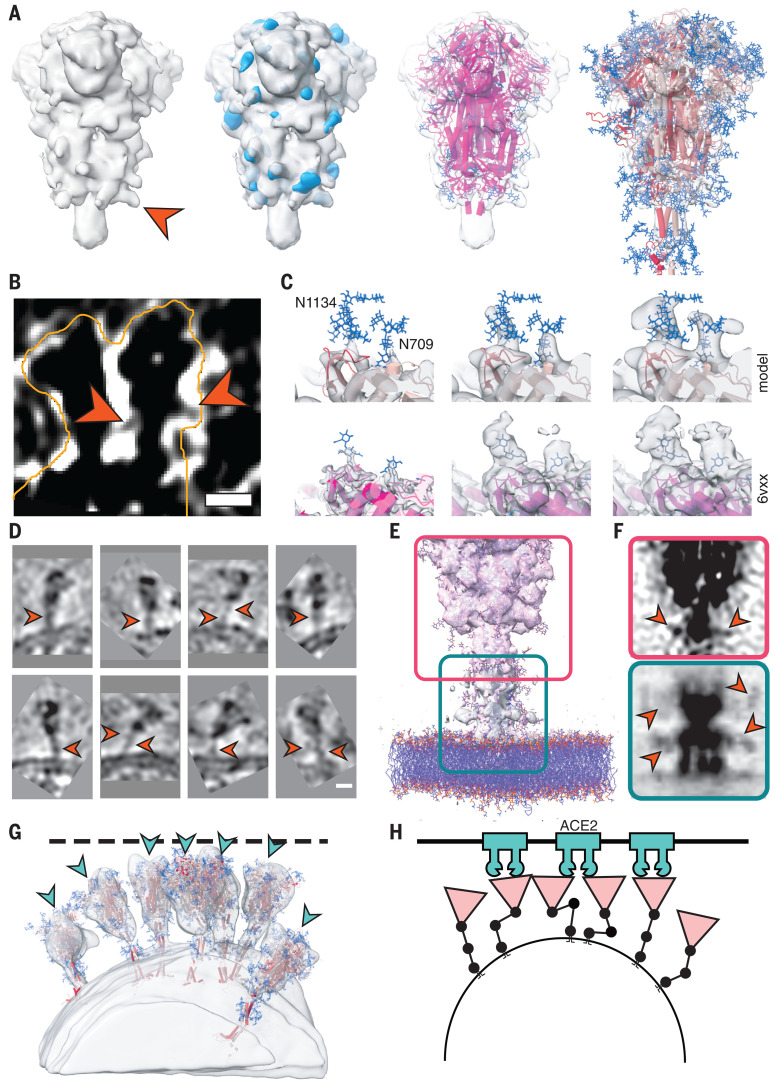
Fig. 5. Analysis of S protein glycosylation sites and epitopes.
(A) N-glycosylation sites are clearly discernible in the subtomogram average of the head. From left to right: Isosurface rendering of subtomogram average with an individual N-glycosylation site indicated (orange arrowhead); superimposed with the MD-calculated density for all annotated N-glycosylation sites; superimposed with previous structural model of the head (PDB ID 6VXX); and superimposed with a snapshot of the MD simulations. N-glycosylation sites are shown in blue. (B) Tomographic slice highlighting an N-glycosylation site (orange arrowheads) in the original data. Scale bar, 5 nm. (C) Highlight of N-glycosylation positions 709 and 1134 of the MD simulations (top) and in a previous structural model (bottom; PDB ID 6VXX, EMDB 21452). The subtomogram average is shown superimposed at different isosurface thresholds (transparent gray). Extensive additional density is visible. (D to F) The stalk domain is heavily glycosylated at the hinges. (D) Example tomographic slices with bulky density at the hinge positions (orange arrowheads). Scale bar, 5 nm. (E) Superposition of the subtomogram averages (transparent gray isosurfaces) of the head (framed red) and the stalk domain (framed green), with a respective snapshot of the MD simulations emphasizing the glycosylation at the hinges. (F) Same as (E) but shown as a maximum intensity projection through the subtomogram averages. Orange arrowheads indicate bulky density at hinges. (G) Fits of snapshots from MD simulations into the surface of a virion. The tomogram is shown isosurface rendered in transparent gray. The position of epitopes for neutralizing antibodies at the RBDs are indicated with blue arrowheads. (H) Cartoon illustrating a hypothetical docking event in which the hinges facilitate the engagement of multiple instances of S with their receptors.

