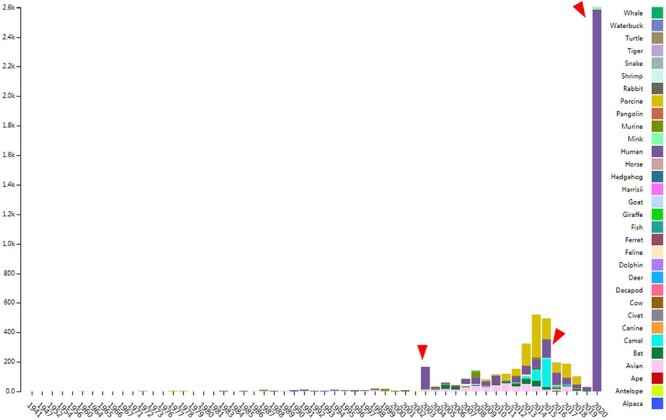
Figure 1.

The distribution of documented coronavirus strains in CoVdb according to collection date (X-axis) and hosts (colored by different colors). Y is the number of coronavirus isolated from some organism. Red triangles points to peaks in the distribution of human coronavirus in years.
