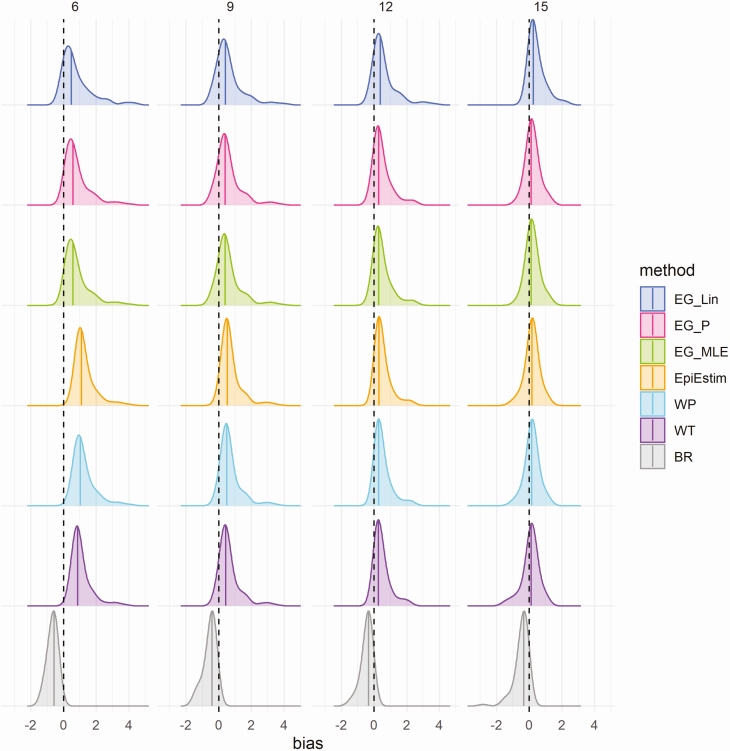
Figure 1.
Density distributions of bias in R0 estimates (estimated R0—actual R0) obtained when fitting to the case time series on simulated data, without noise, by method and time point (in weeks), using only results from simulations that peaked at or after 15 weeks (n = 145). Columns represent the number of data points (weeks) each method was fitted to in the case time series (6, 9, 12, and 15 weeks, approximating to 2, 3, 4, and 5 generation times), and colors represent the method. Black dashed lines highlight the ideal bias value of 0, and colored lines represent method-specific values of median bias. Abbreviations: BR, Bettencourt and Ribeiro; EG_Lin, linear exponential growth rate method; EG_MLE, maximum likelihood exponential growth rate method; EG_P, Poisson exponential growth rate method; WP, White and Pagano method; WT, Wallinga and Teunis.

