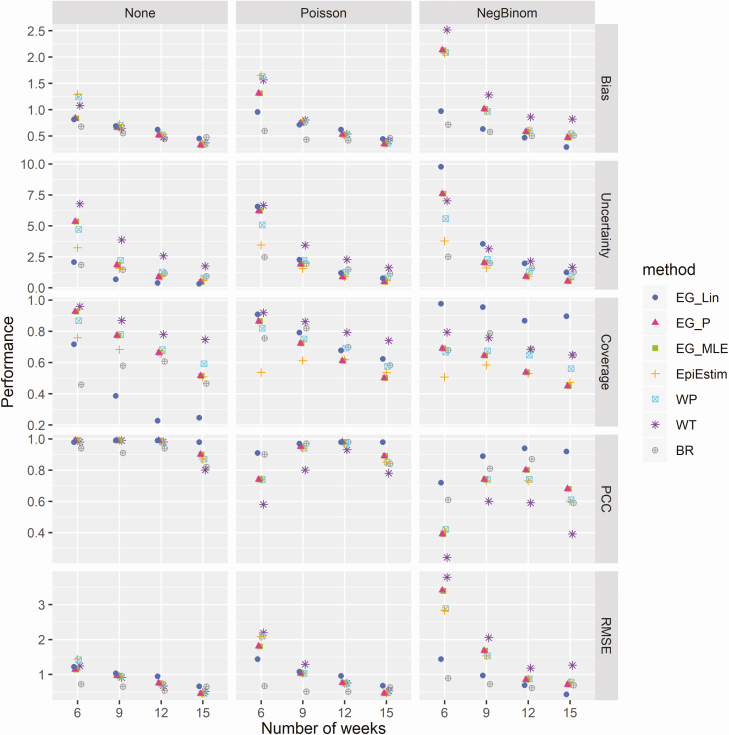
Figure 2.
Comparative analysis of the performance of the 6 methods at different stages of the epidemic. Columns represent the 3 data noise scenarios explored (no noise, Poisson noise, and negative binomial noise). Rows represent different performance metrics: absolute bias (the absolute average difference between estimated and true R0 values), uncertainty (95% confidence interval width), coverage (proportion of times in which the true R0 value is within the estimated 95% confidence intervals), PCC, and RMSE. Abbreviations: BR, Bettencourt and Ribeiro; EG_Lin, linear exponential growth rate method; EG_MLE, maximum likelihood exponential growth rate method; EG_P, Poisson exponential growth rate method; PCC, Pearson correlation coefficient; RMSE, root mean squared error; WP, White and Pagano method; WT, Wallinga and Teunis.

