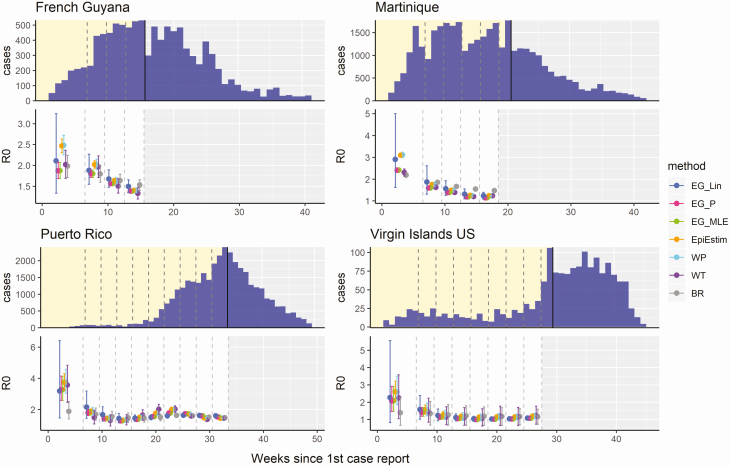
Figure 3.
R0 estimates obtained from each of the 6 methods, fitted at different stages of the 2015–2016 Zika epidemics in French Guyana, Martinique, Puerto Rico, and the US Virgin Islands. The top panel for each country shows the time series of reported Zika cases, with dashed lines showing the different stages at which each method was fitted to the data (first 6, 9, 12, etc.; in weeks) up to the peak of the epidemic, marked by the black line. The bottom panel for each country shows the mean and 95% confidence intervals of the R0 estimates produced with each method fitted to each time series. Abbreviations: BR, Bettencourt and Ribeiro; EG_Lin, linear exponential growth rate method; EG_MLE, maximum likelihood exponential growth rate method; EG_P, Poisson exponential growth rate method; WP, White and Pagano method; WT, Wallinga and Teunis.

