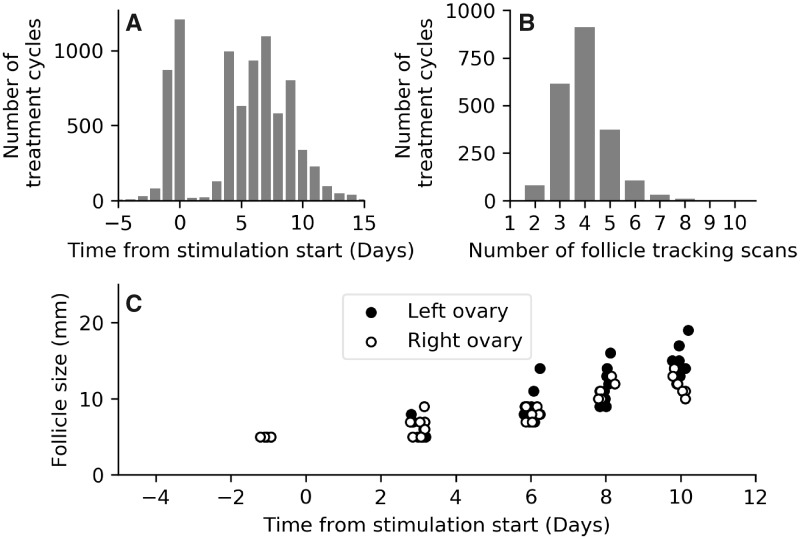
Figure 1.
Ultrasound scan frequency during treatment cycles. (A) Proportion of cycles (vertical axis) having a scan on each given day of the cycle (horizontal axis, most scans occur between Days 4 and 9 from stimulation start). n= 2128 cycles. (B) Histogram of the total number of scans for a given cycle. (C) Follicle growth chart for a single patient in the study, with HCG trigger injection administered on cycle Day 14 (11 days from stimulation start). A small horizontal jitter has been added to the data points to improve the visualisation.

