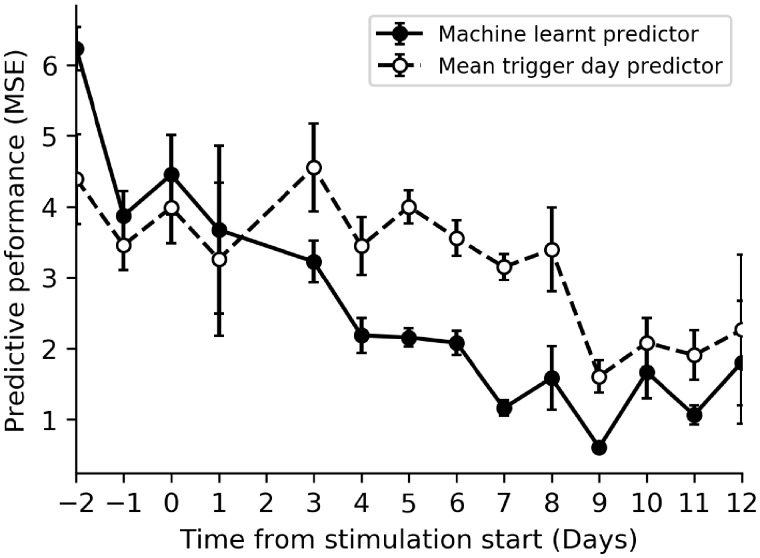
Figure 3.
Model performance when predicting trigger day versus a heuristic predictor that assumes all patients are triggered on the mean day of trigger administration. Vertical axis is the mean squared error (MSE) between predicted trigger day and actual trigger day. Solid black line and points display performance for the machine-learnt regressor, and dashed black line and points display the performance if we assume all patients are triggered on the mean day. Any day with <100 scans in the database was removed. Error bars represent the SD of the model performance across the validation folds, which yield an estimate of the CI of the models’ performance. n= 2128 cycles.

