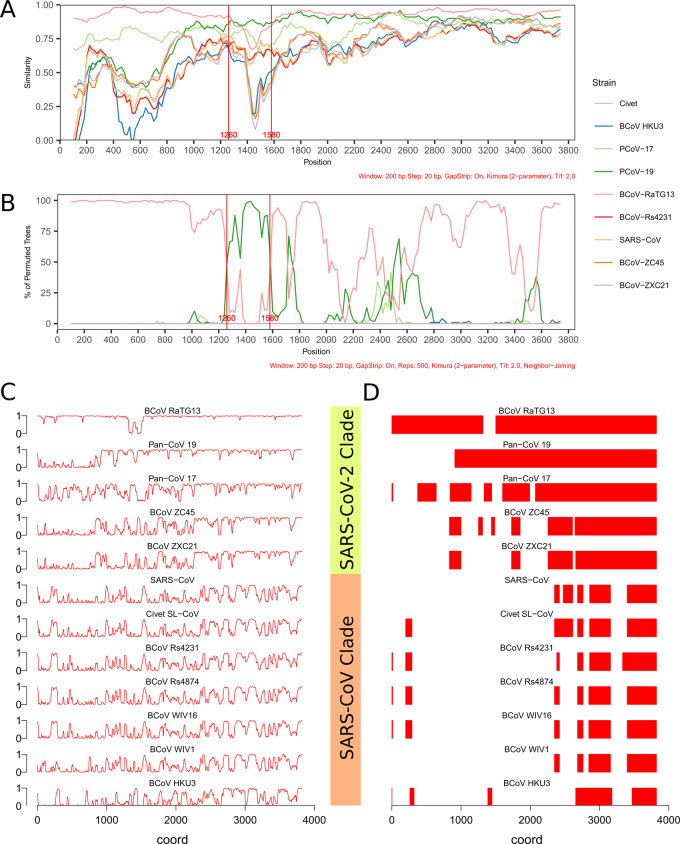
Figure 3.
(A) Similarity plot of CoV strains in SARS-CoV-2 clade as well as SARS-CoV and civet SARS-like CoV. Region between 1260 and 1580 bp corresponds to the latter half of RBD, including full RBM. (B) Bootscan plot of CoV strains in SARS-CoV-2 clade as well as SARS-CoV and civet SARS-like CoV. (C) Plot of Phastcons scores along nucleotide sequence of spike in SARS-CoV-2 and SARS-CoV CoV strains. Phastcons score ranges from 0 to 1, the higher the score, the more conserved the region. (D) Plot of conserved elements in the same CoV strains as in (C), showing contiguous regions of high conservation scores in the spike sequence of each strain

