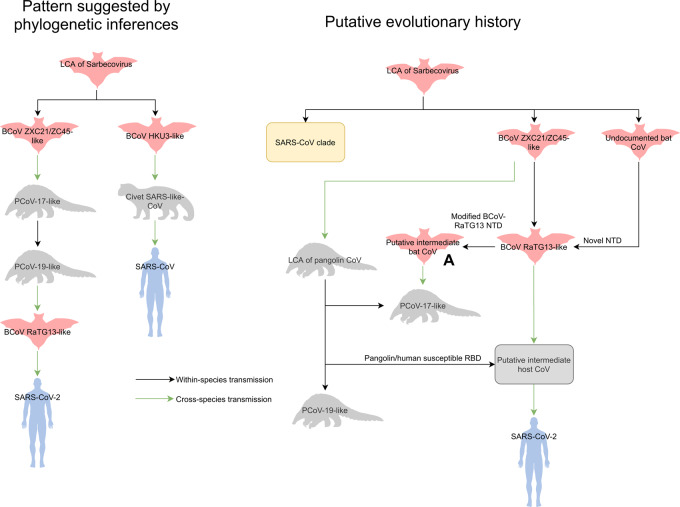
Figure 6.
Schematic diagram of possible evolutionary history. Left: Pattern suggested based on full-genome phylogenetic inference. Right: Putative order based on analyses of spike sequences, introducing possible intermediates to explain the discrepancies in phylogenetics of NTD, RBD and S2 subunit of spike nucleotide sequence

