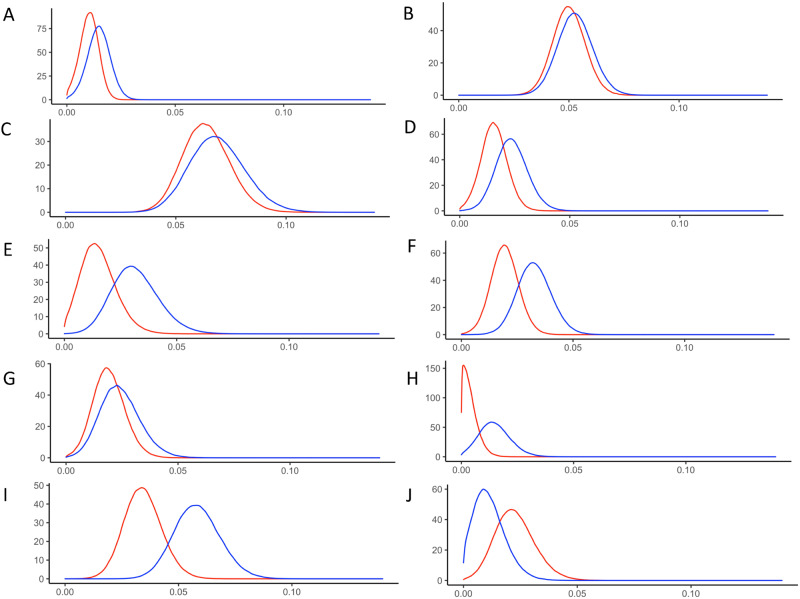
Figure 1.
The posterior probability density of the prevalence of female (red) and male (blue) infected by SARS-CoV-2 virus in 10 US sites: (A) Western Washington State, (B) New York City metro area, (C) Louisiana, (D) South Florida, (E) Philadelphia metro area, (F) Missouri, (G) Utah, (H) San Francisco Bay area, (I) Connecticut, and (J) Minneapolis metro area.

