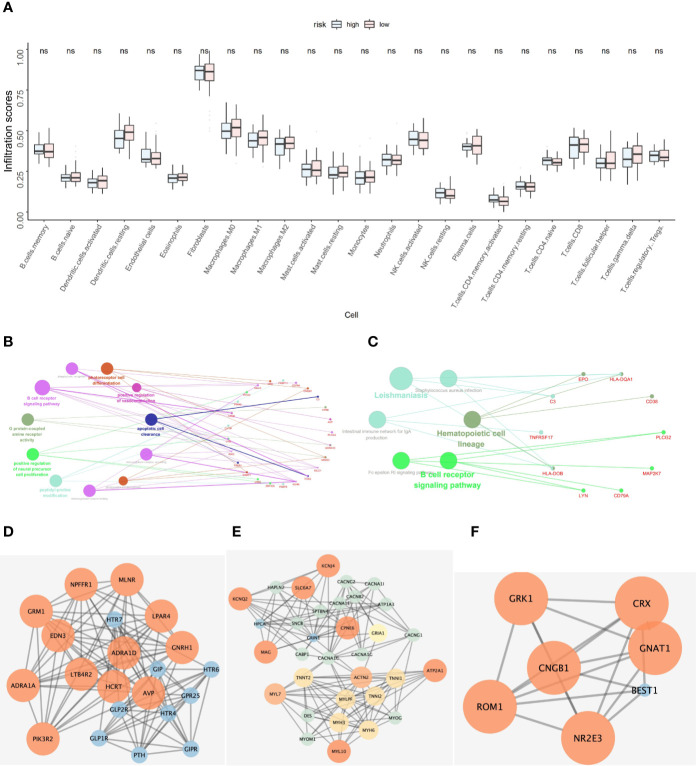
Figure 5.
(A) Hubgene infiltration in 24 immune cells in high-risk and low-risk groups of ACT patients. (B) Functional enrichment results of co-expressed genes of five key prognostic genes. (C) Pathway enrichment results of co-expressed genes for five key prognostic genes. (D–F) Protein-protein interaction network of co-expressed genes of five key prognostic genes.

