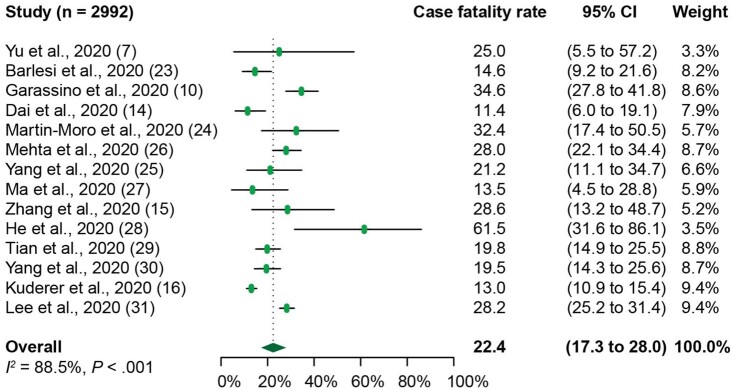
Figure 2.
Forest plot of overall case fatality rate of patients with cancer and Coronavirus disease 2019 (COVID-19) from 14 individual studies analyzed. The Cochran’s Q test was used to identify heterogeneity and to calculate the P values. Heterogeneity was further quantified using I2 as described in the Methods. CI = confidence interval.

