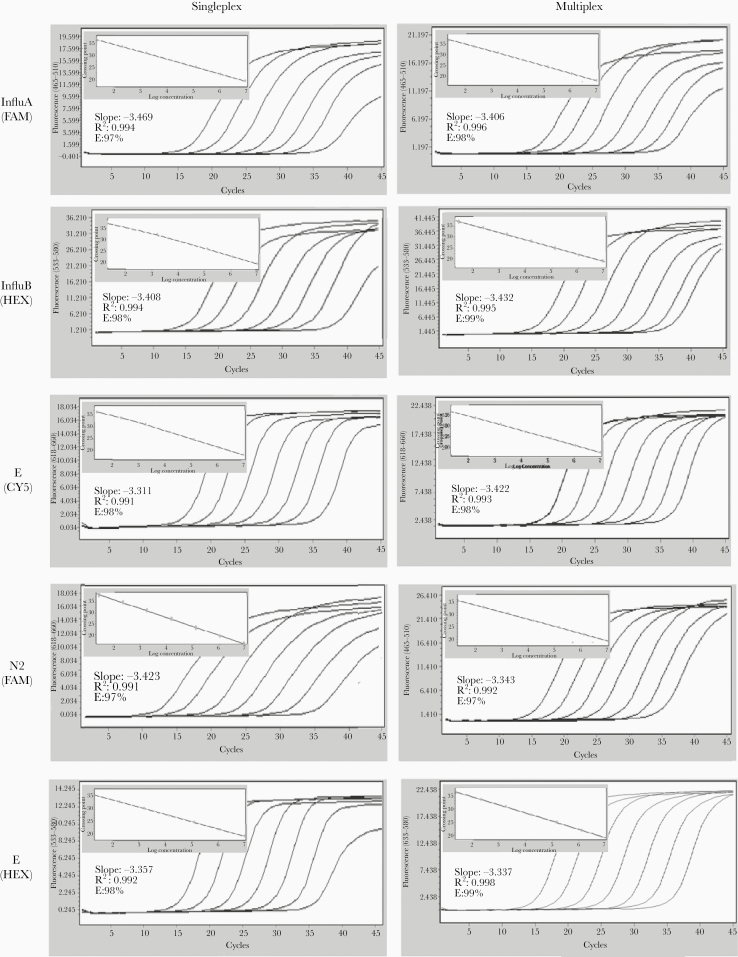
Figure 1.
LC480II plot amplifications and standard curves of the singleplex and multiplex assays. Each assay was tested using related standard ranging from 107 to 10 copies/μL. Polymerase chain reaction curve data are represented by relative fluorescence plotted against cycle threshold (Ct) values. Standard curves were generated from the Ct values obtained against known concentrations. Slope of the regression curve, the coefficient of determination (R2), and efficiency (E) are indicated for each assay.

