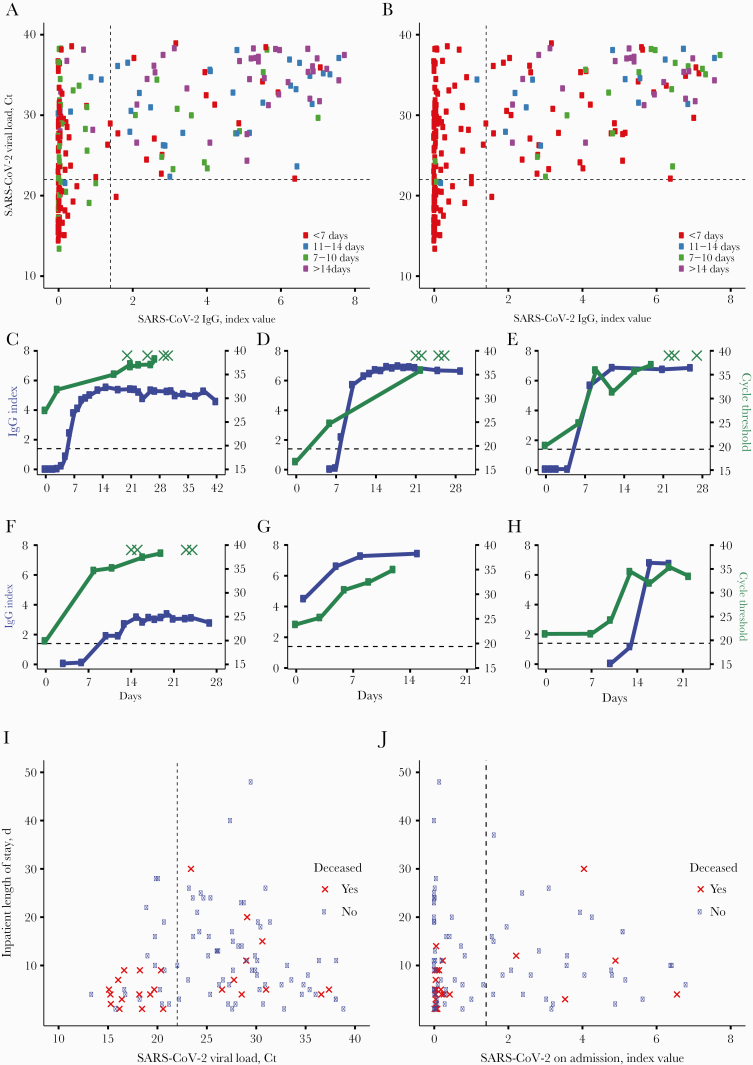
Figure 1.
A and B, Unique patient-days with an antinucleocapsid IgG index value and viral load (qRT-PCR Ct value) on the same calendar day. The dashed vertical line indicates the manufacturer’s seropositivity index value cutoff of 1.40. The dashed horizontal line indicates a Ct value of 22. Colors indicate days from symptom onset (A) or days since first positive PCR (B). C–H, Six representative patients with >3 IgG (blue) and Ct (green) results available over the course of their hospital stay. X-axis indicates days from first positive PCR. Dashed horizontal line indicates IgG cutoff of 1.40. Green Xs indicate RT-PCR results with no nucleic acid detected. I, Patients with a Ct value available on the day of admission. Red X data points indicate patients who expired within 30 days of their first positive PCR result. The dashed vertical line indicates the manufacturer’s seropositivity threshold of 1.40. J, Patients with an IgG result available on the day of admission. Red X data points indicate patients who expired within 30 days of first positive PCR result. The dashed vertical line indicates a Ct value of 22. Abbreviations: Ct, cycle threshold; IgG, immunoglobulin G; PCR, polymerase chain reaction; qRT-PCR, quantitative reverse transcription polymerase chain reaction; RT-PCR, reverse transcription polymerase chain reaction.

