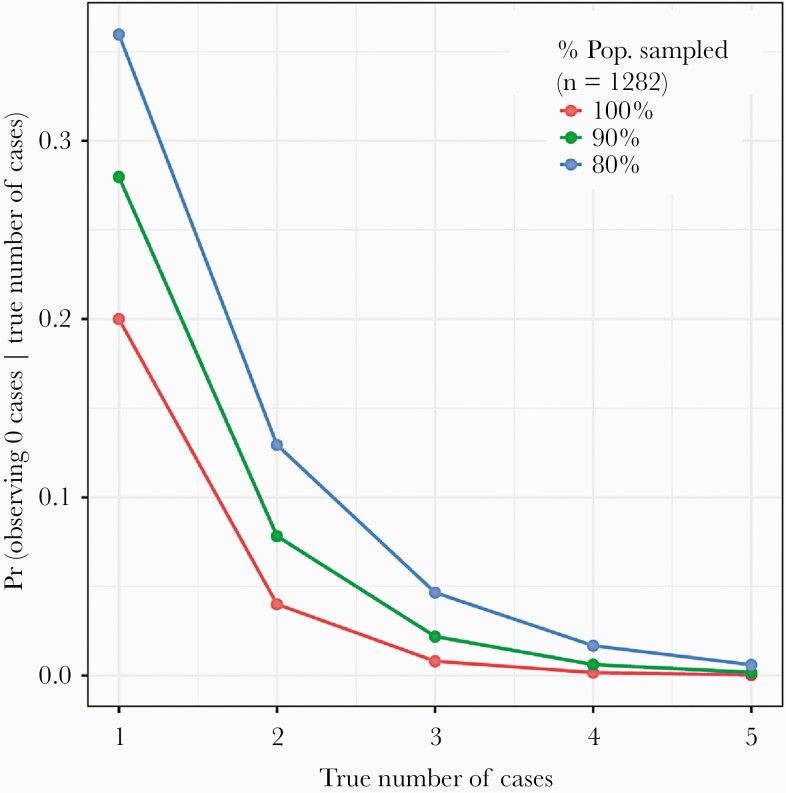
Figure 1.
Probability of observing 0 cases given the true number of cases (y-axis), across a range of true numbers of cases (x-axis) and the proportion of the total population that was sampled (red, green, and blue lines). For example, assuming that we had sampled the entire population (red line), the probability of observing 0 cases if there truly had been 1 case is 0.2 or 20%; the probability of observing 0 cases if there truly had been 3 cases is 0.008.

