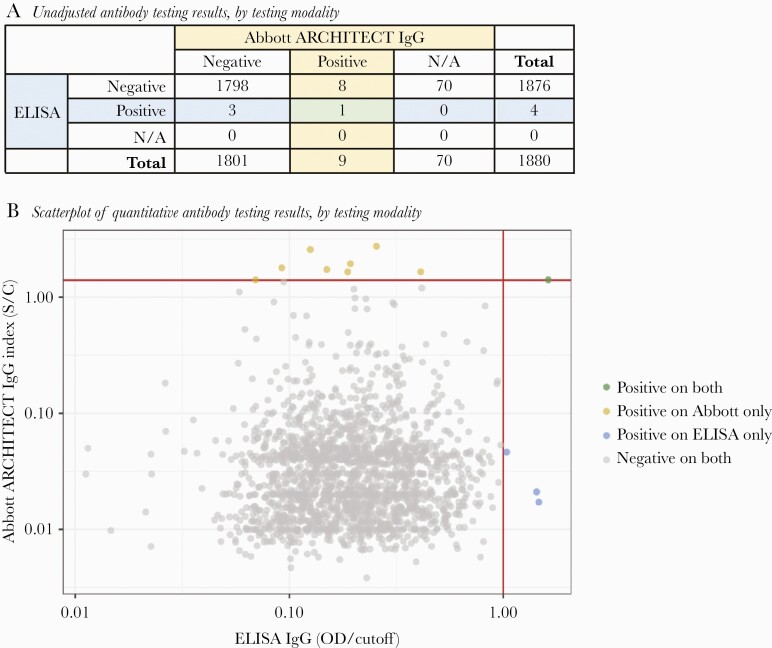
Figure 2.
(A) illustrates the number of specimens that were positive and negative, by testing modality. N/A indicates samples not run on Abbott assay due to insufficient plasma volume. (B) illustrates the quantitative results of antibody tests that were run on both assays (n = 1810) with colors denoting positive results. Abbott ARCHITECT immunoglobulin (Ig)G signal to cutoff values are shown on the y-axis with enzyme-linked immunosorbent assay (ELISA) IgG optical density to cutoff values on the x-axis.

