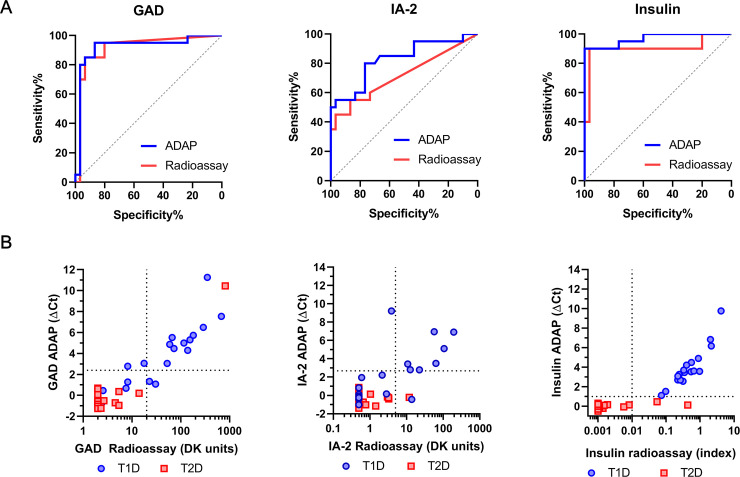
Fig 3. Validation of ADAP performance in a cohort of T1D and T2D samples.
(A) The ROC curves of ADAP showed AUC of 0.92 (95%CI: 0.83–1.00), 0.83 (95%CI: 0.70–0.95) and 0.97 (95%CI: 0.92–1.00) for GAD, IA-2 and insulin antibodies/autoantibodies respectively. The samples were also analyzed by radioassay and showed corresponding AUC of 0.91 (95%CI: 0.82–1.00), 0.72 (95%CI: 0.56–0.87) and 0.90 (95%CI: 0.79–1.00). (B) Comparison plots of ADAP and radioassay signals. The x-axis displays radioassay signals in logarithm scales. The y-axis shows ADAP signal in ΔCt. The horizontal and the vertical dash lines denote ADAP and radioassay cutoff thresholds respectively. T1D sample data is shown in blue circle, whereas health serum signal is shown in red square. This cohort included 20 T1D and 30 T2D, and was analyzed with blinding.

