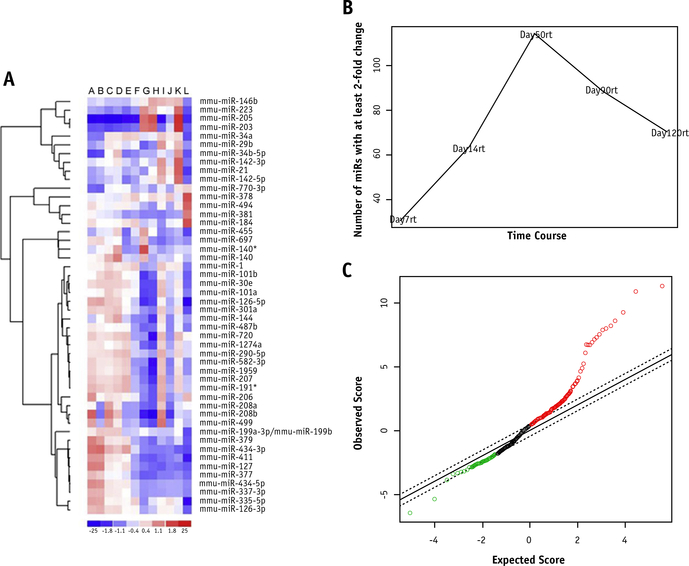
Fig. 2.
MicroRNA microarray heat map and analysis. miR arrays were performed on days 7, 14, 50, 90, and 120 after irradiation on both fibrotic and control legs. A heat map was generated to evaluate changes in miRs with a standard deviation of ≥0.5 between each time point (A); they are arranged as s from left to right: 2 day 0 controls (A and B), 7 days after irradiation (C and D), 14 days after irradiation (E), 50 days after irradiation (F and G), 90 days after irradiation (H and I), and 120 days after irradiation (J and K), and a day 120 control (L). miRs with a 2-fold change in expression (reference time-point day 0) are graphed as a function of days after irradiation (B). A significant analysis of microarrays plot was generated to help determine significantly altered miRs (C).

