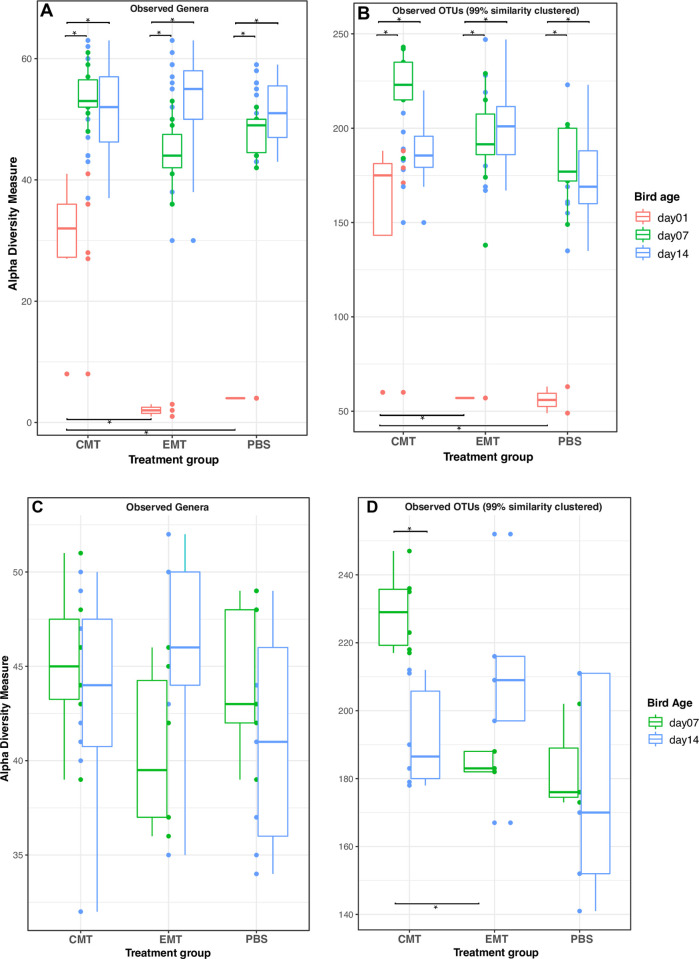
Fig 3. Community richness by treatment group and time for unchallenged and challenged groups.
Only taxa with abundances greater than 5 in the dataset and samples with 1000 sequences are retained. All samples were rarefied to even depth A) Operational taxonomic units defined at the Genus-level (n = 1012 per sample) for non-pathogen challenged group. B) Operational taxonomic units defined at the 99% sequence similarity-level (n = 1044 per sample) for non-pathogen challenged group. C) Operational taxonomic units defined at the Genus-level (n = 1012 per sample) for pathogen challenged group. D) Operational taxonomic units defined at the 99% sequence similarity-level (n = 1044 per sample) for pathogen challenged group. Horizontal bars with asterisks denote significant differences between comparison pairs (student t-test, alpha = 0.05). Significant differences within MT groups and between MT groups are depicted at the top and bottom of the figure, respectively.

