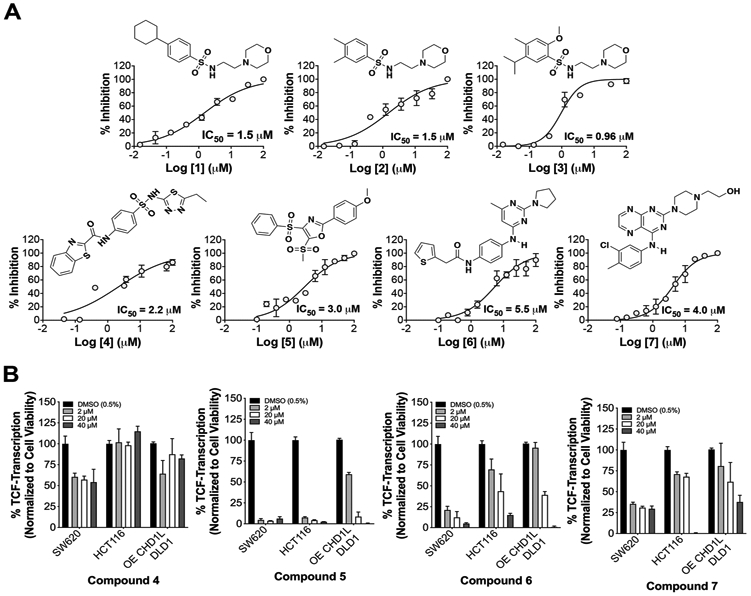
Figure 3: Validation of CHD1L inhibitors identified from HTS.

(A) cat-CHD1L ATPase IC50 dose responses with hits 1-7. Mean IC50 values are calculated from three independent experiments and representative graphs are shown. (B) SW620, HCT116, and DLD1CHD1L-OE cells with TOPflash reporter were used to measure inhibition of TCF-transcription using 3 doses over 24 h.
