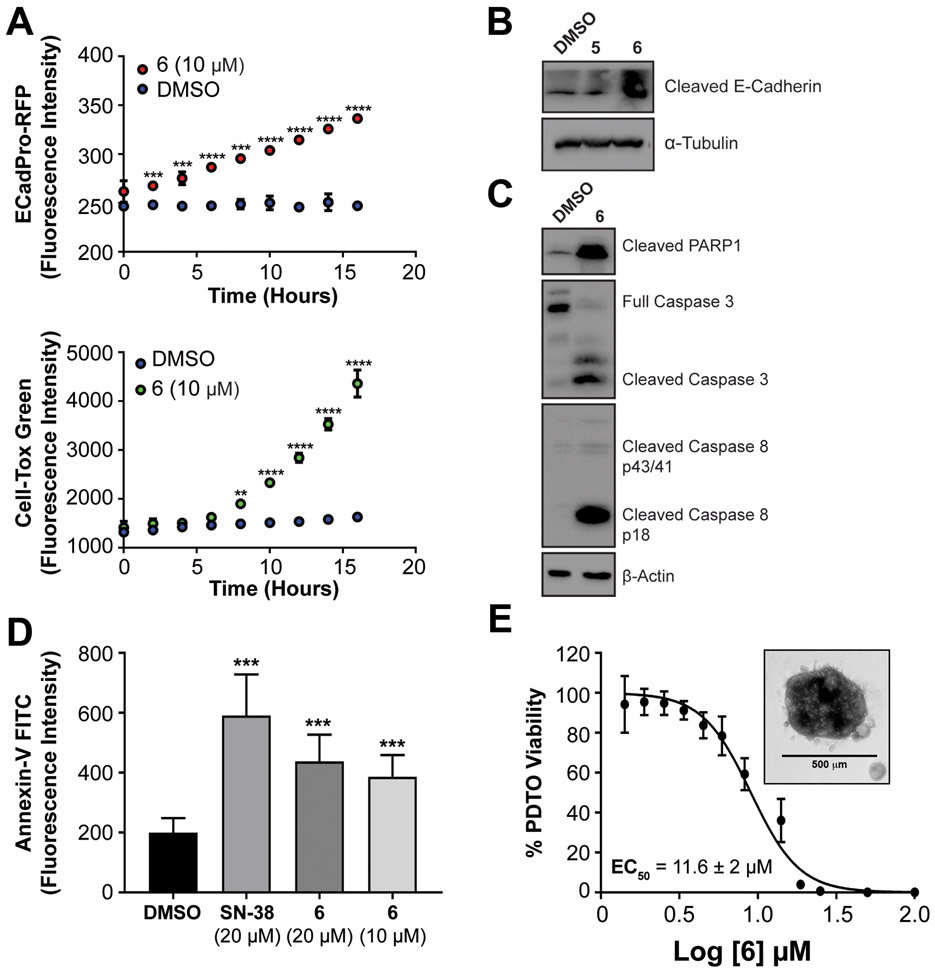
Figure 5: Lead compound 6 induces apoptosis in CRC cell lines and PDTOs.
(A) Time course evaluation of the induction E-cadherin expression using Ecad-ProRFP reporter assay and cytotoxicity using Cell-Tox Green. (B) Western blot analysis of induction of cleaved E-cadherin after treatment of 5 and 6 for 48 hours in CRC organoids. (C) Western blot analysis of induction of caspase dependent apoptosis cadherin after treatment of 6 for 48 hours in CRC organoids. (D) Annexin V-FITC staining analysis of apoptosis after treatment of SN-38 and 6 for 12 hours (E) Cytotoxicity of 6 in PDTO CRC102 using CellTiter-Blue. Mean EC50 values ± s.d. are calculated from six independent experiments and representative graph is shown with inset of a representative PDTO. Welch’s t-test statistical analysis was used to determine significance, where * = P ≤ 0.05, ** = P ≤ 0.01, *** = P ≤ 0.001, **** = P ≤ 0.0001.

