. 2020 Nov 2;9:e62907. doi: 10.7554/eLife.62907

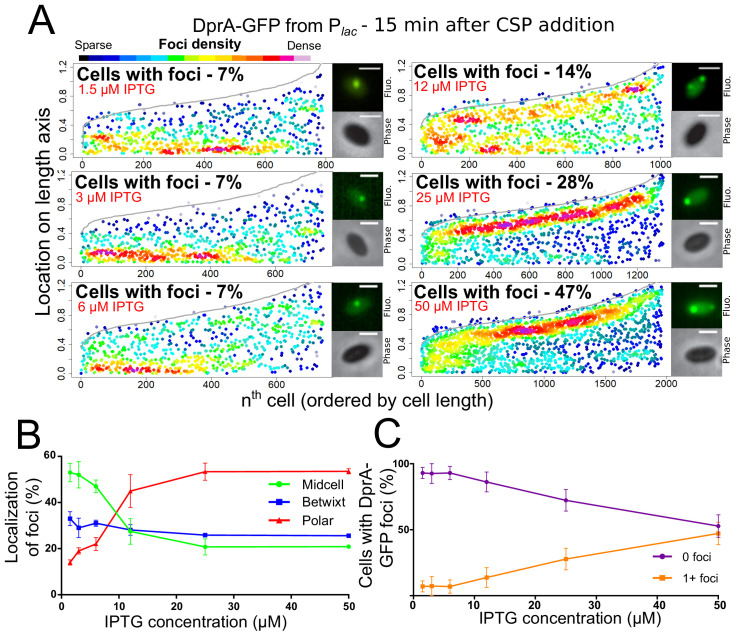
Figure 2. Reducing cellular DprA-GFP levels results in loss of polar accumulation and competence shut-off.

(A) Focus density maps of DprA-GFP foci at different cellular levels during competence. CEPlac-dprA-gfp from strain R4262. Cellular DprA-GFP levels were controlled by growing cells in a gradient of IPTG. 1.5 µM IPTG, 11267 cells and 791 foci analyzed; 3 µM IPTG, 10623 cells and 748 foci analyzed; 6 µM IPTG, 10603 cells and 743 foci analyzed; 12.5 µM IPTG, 6985 cells and 1010 foci analyzed; 25 µM IPTG, 2945 cells and 1345 foci analyzed; 50 µM IPTG, 3678 cells and 1964 foci analyzed. Sample microscopy images of strain R4262 in varying IPTG concentrations. Scale bars, 1 µm. (B) Reducing cellular levels of DprA-GFP reduces the number of cells with foci. Error bars represent triplicate repeats. (C) Reducing cellular levels of DprA-GFP results specifically in loss of polar foci. Error bars represent triplicate repeats.

Figure 2.

Figure 2—figure supplement 1. Validation of CEPlac-dprA-gfp activity.
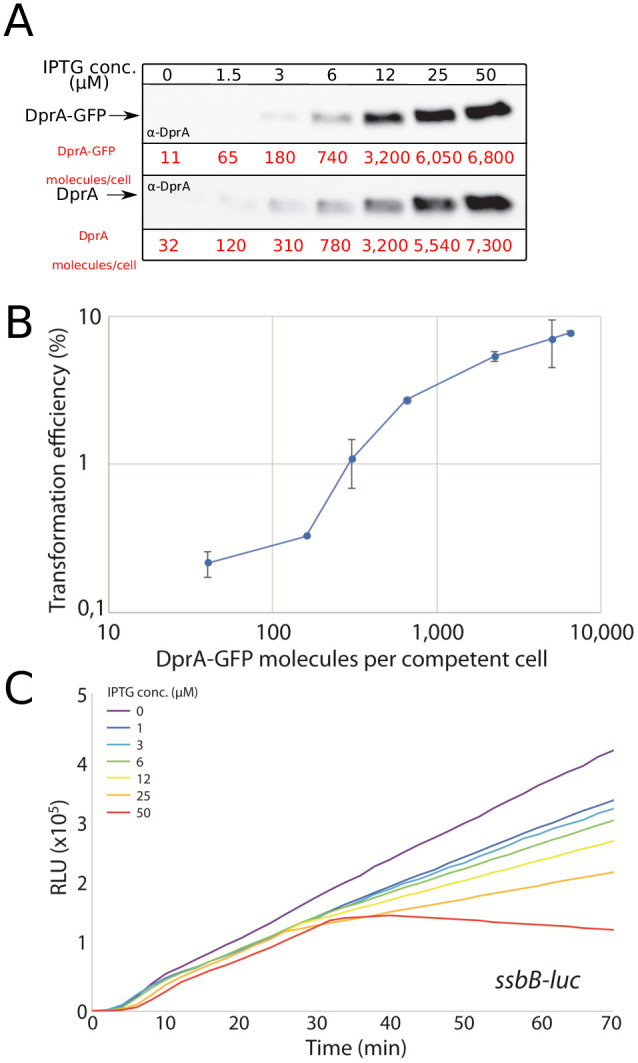
Figure 2—figure supplement 1.

(A) Western blots comparing cellular levels of DprA (R3833) and DprA-GFP (R4262) produced from the CEPlac platform in cells lacking native dprA in varying concentrations of IPTG. α-DprA antibodies used. Samples at each IPTG concentration corrected by OD to render direct comparison of cellular levels possible. Cellular levels of DprA-GFP estimated from Western blots compared to purified DprA as previously described (Johnston et al., 2018). (B) Transformation efficiency of a CEPlac-dprA-gfp, dprA- strain (R4262) in an IPTG concentration gradient. R304 chromosomal DNA (50 ng mL−1), conferring streptomycin resistance via rpsL41 point mutation (Salles et al., 1992), used to transform. Error bars represent triplicate repeats. (C) Competence profiles of a R4262 strain possessing CEPlac-dprA-gfp and ssbB-luc in an IPTG concentration gradient. Appropriate IPTG concentration present from the beginning of the culture. Competence induced by addition of CSP at t = 0, when OD = ~0.05. Plots representative of triplicate repeats.