. 2020 Nov 2;9:e62907. doi: 10.7554/eLife.62907

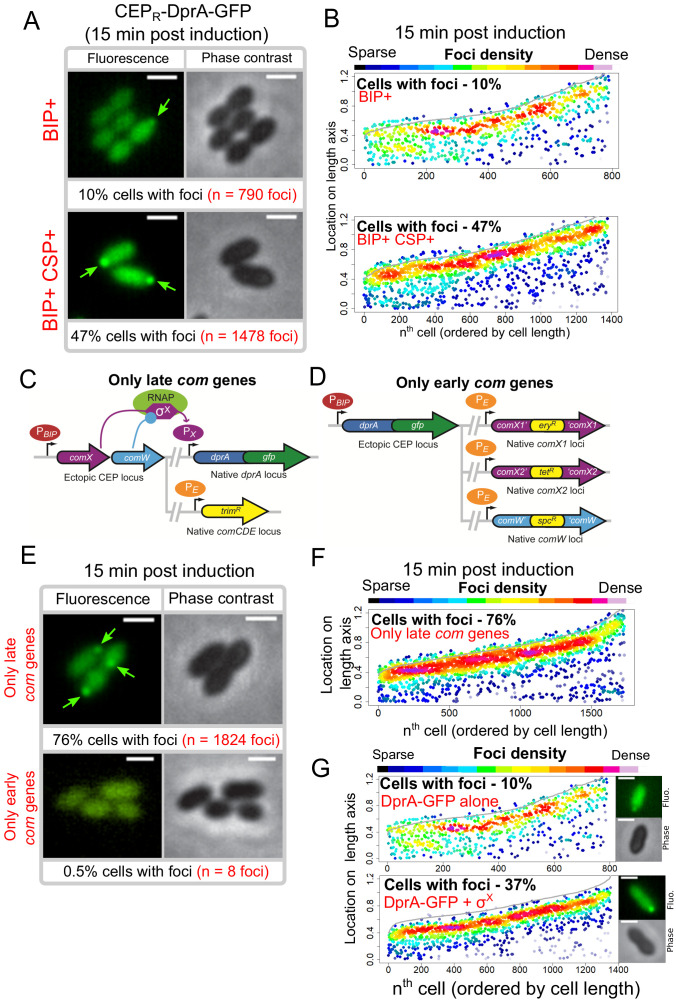
Figure 4. Polar accumulation of DprA-GFP appears to depend on late com regulon expression.

(A) Sample fluorescence microscopy images of strain R4060 producing DprA-GFP 15 min after induction with BIP or BIP and CSP. Scale bars, 1 µm. (B) Competence induction is required for optimal accumulation of DprA-GFP at the cell poles. Focus density maps as in Figure 1E. BIP+, 7845 cells and 790 foci analyzed; BIP+ CSP+, 2707 cells and 1478 foci analyzed. (C) Genetic context strain R4107 expressing dprA-gfp and only the late com regulon. PBIP and PX as in panel A, PE represents early com promoter controlled by ComE. Light blue circle, ComW; light green oval, RNA polymerase; purple hexagon, σX. (D) Genetic context of strain R4140 expressing CEPR-dprA-gfp and only the early com regulon. PBIP as in panel A, PE as in panel D. (E) Sample fluorescence microscopy images of strains producing DprA-GFP with only late (R4107) or only early (R4140) com operons 15 min after competence induction. Scale bars, 2 µm. (F) Induction of the late com regulon is required for accumulation of DprA-GFP at the cell poles. Focus density maps as in Figure 1E. 1988 cells and 1824 foci analyzed. (G) Focus density maps produced as in Figure 1E from images where DprA-GFP was produced outside of competence in presence or absence of σX. DprA-GFP alone, 7845 cells and 790 foci analyzed; DprA-GPF + σX, 3545 cells and 1355 foci analyzed. Strains used: DprA-GFP alone, R4060; DprA-GFP and σX, R4489.

Figure 4.

Figure 4—figure supplement 1. Validation of strains expressing CEPR-dprA-gfp and the late com regulon alone.
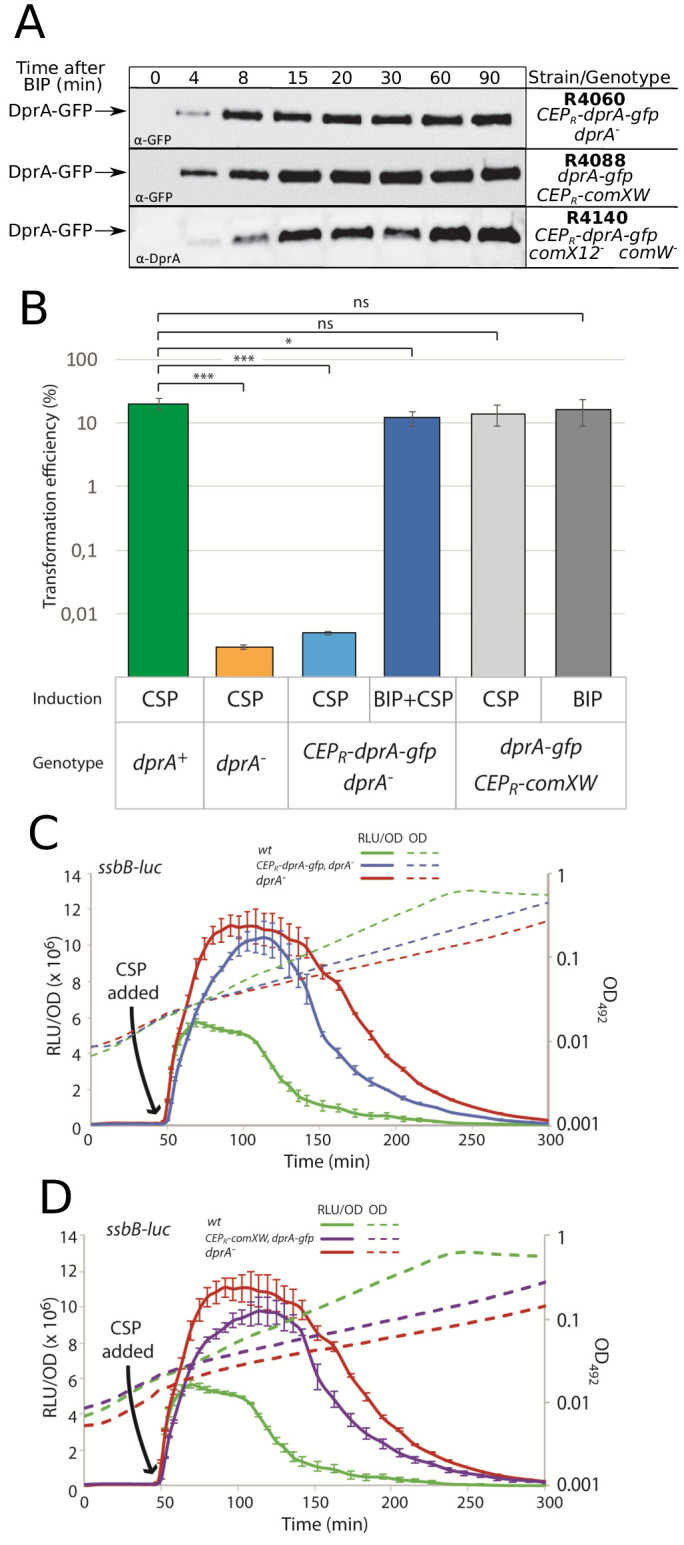
Figure 4—figure supplement 1.

(A) Western blots tracking cellular levels of DprA-GFP in R4060 (CEPR-dprA-gfp dprA-), R4088 (dprA-gfp CEPR-comXW) and R4140 (CEPR-dprA-gfp comX12- comW-) strains after induction with BIP. Either α-GFP or α-DprA antibodies used. Samples at each timepoint corrected by OD to render direct comparison of cellular levels possible. (B) Comparing transformation efficiencies of isogenic strains impaired for competence auto-induction. R1501 (‘wildtype’), R2018 (dprA-), R4060 (CEPR-dprA-gfp dprA-), and R4088 (dprA-gfp CEPR-comXW) strains after induction with either CSP, BIP or both, as shown. rpsL41 PCR fragment, conferring streptomycin via point mutation (Salles et al., 1992), used to transform at 50 ng mL−1. Error bars represent triplicate repeats. Statistical differences between wildtype and mutants determined by Student’s T-test using GraphPad Prism. p values as followed compared to wildtype. dprA-, p=0.0002; CEPR-dprA-gfp dprA- CSP+, p=0.0002; CEPR-dprA-gfp dprA- CSP+ BIP+, p=0.0109; dprA-gfp CEPR-comXW CSP+, p=0.286; dprA-gfp CEPR-comXW BIP+, p=0.218. (C) Exploring the competence profile of a strain ectopically expressing DprA-GFP under the control of BIP. R1501 (wildtype), R2018 (dprA-) and R4060 (CEPR-dprA-gfp dprA-) strains. Experiment carried out as as in Figure 1—figure supplement 1D. Error bars represent triplicate repeats. (D) Exploring the competence profile of a strain ectopically expressing σX and ComW under the control of BIP and DprA-GFP from its native promoter. R1501 (wildtype), R2018 (dprA-), and R4088 (CEPR-comXW, dprA-gfp, cbpD::cat) strains. Experiment carried out as in Figure 1—figure supplement 1D. Error bars represent triplicate repeats.