. 2020 Nov 2;9:e62907. doi: 10.7554/eLife.62907

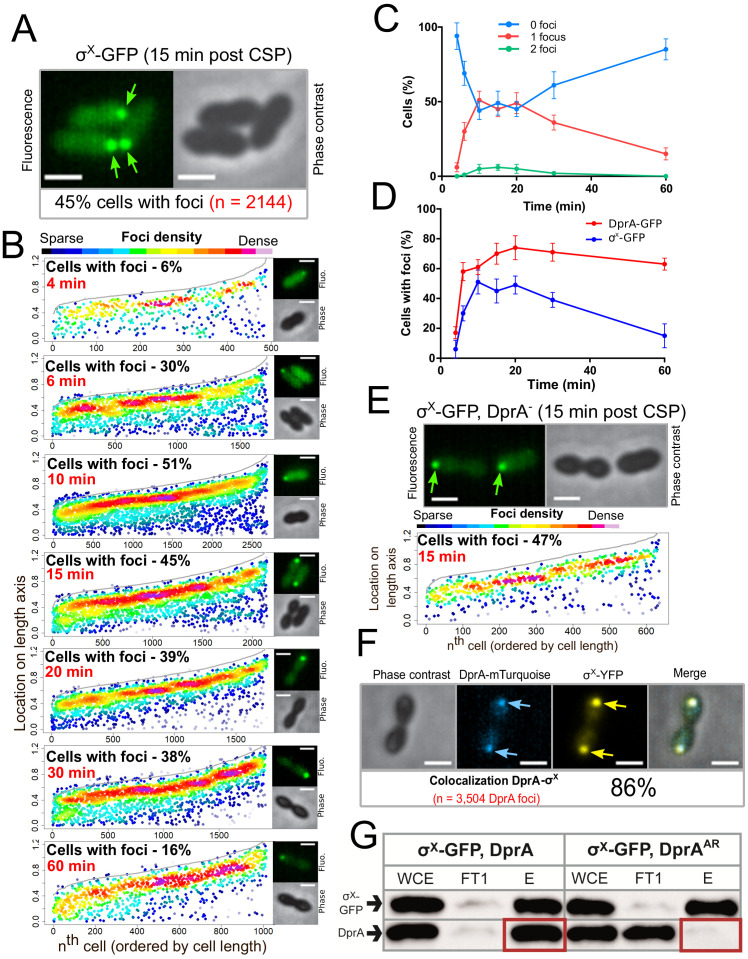
Figure 5. σX-GFP interacts directly with DprA at the cell pole during competence.

(A) Sample fluorescence microscopy images of strain R4451 producing σX-GFP from comX1 and wild-type σX from comX2 15 min after competence induction. Scale bars, 1 µm. (B) σX-GFP accumulates at the cell pole during competence. Focus density maps presented as in Figure 1E. 4 min, 7544 cells and 489 foci analyzed; 6 min, 5442 cells and 1711 foci analyzed; 10 min, 4358 cells and 2691 foci analyzed; 15 min, 3746 cells and 2144 foci analyzed; 20 min, 4211 cells and 1754 foci analyzed; 30 min, 4695 cells and 1920 foci analyzed; 60 min, 5713 cells and 1016 foci analyzed. (C) Most cells have a single σX-GFP focus. Data from the time-course experiment presented in panel B showing the number of foci per cell at each time point. Error bars represent triplicate repeats. (D) DprA-GFP foci persist in cells longer than σX-GFP foci. Comparison of cells with foci at different timepoints from timecourse experiments. DprA-GFP from Figure 3A, σX-GFP from panel B. Error bars represent triplicate repeats. (E) Accumulation of σX at the cell poles does not depend on DprA. Sample microscopy images of a comX1-gfp, dprA- strain (R4469). Focus density maps generated from cells visualized 15 min after competence induction presented as in Figure 1E. 1104 cells and 638 foci analyzed. (F) σX and DprA colocalize at the cell pole. Colocalization of σX-YFP and DprA-mTurquoise in R4473 cells visualized 15 min after competence induction. 7460 cells and 3504 DprA-mTurquoise foci analyzed. Scale bars, 1 µm. (G) DprA is copurified with σX-GFP while DprAAR is not. Western blot of pull-down experiment carried out on strains producing σX-GFP and either DprA (R4451) or DprAAR (R4514) 10 min after competence induction. WCE, whole cell extract; FT1, flow through; E, eluate.

Figure 5.

Figure 5—figure supplement 1. σX is necessary and sufficient to mediate accumulation of DprA at the cell poles.
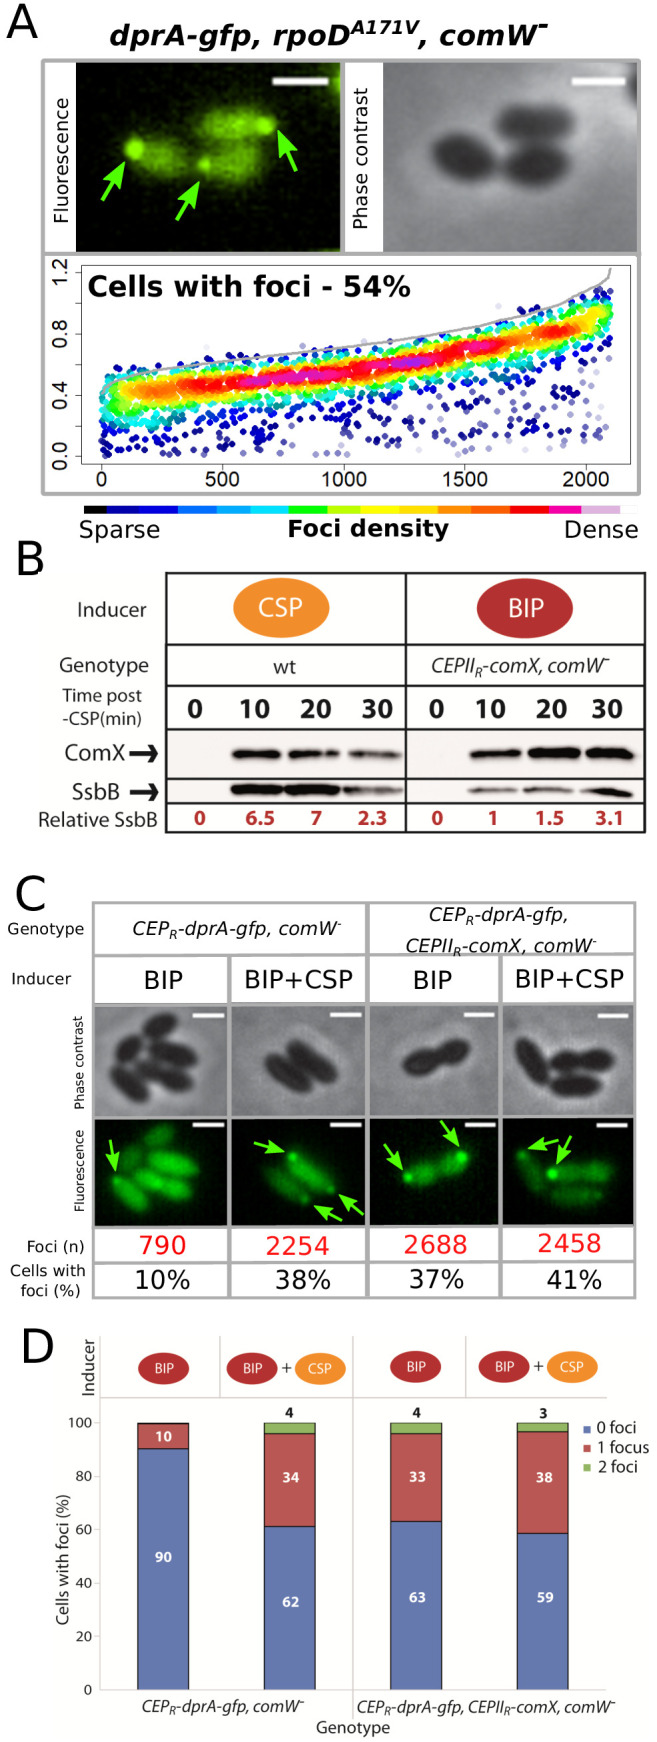
Figure 5—figure supplement 1.

(A) DprA-GFP accumulates at the cell poles in the absence of ComW. Localization of DprA-GFP in R4168 strain (dprA-gfp, rpoDA171V, comW-) 15 min after competence induction. Sample fluorescence microscopy images shown. Scale bars, 1 µm. Focus density maps presented as in Figure 3B. 3592 cells and 2101 foci analyzed. (B) Production of σX outside of competence promotes accumulation of DprA-GFP at the cell poles. Sample fluorescence microscopy images of cells producing DprA-GFP (R4060) or DprA-GFP and σX (R4489) outside of competence. Focus density maps presented as in Figure 3B. DprA-GPF + σX, 3545 cells and 1355 foci analyzed. CEPR-dprA-gfp induced by BIP, 7845 cells and 790 foci analyzed; CEPR-dprA-gfp induced by BIP and CSP, 5889 cells and 2254 foci analyzed; CEPR-dprA-gfp, CEPIIR-comX induced by BIP, 3545 cells and 1355 foci analyzed; CEPR-dprA-gfp, CEPIIR-comX induced by BIP and CSP, 6085 cells and 2458 foci analyzed. Scale bars, 1 µm. (C) Data from analysis of images in panel A split into cells with 0, 1 or two foci. (D) Western blot comparing expression of late com regulon by tracking cellular levels of SsbB in R1501 (wildtype) and R4509 (CEPIIR-comX, comW-) strains. R1501 induced by CSP at t = 0 and R4509 induced by BIP. Samples at each time point corrected by OD to render direct comparison of cellular levels possible. Relative SsbB levels measured by quantifying SsbB bands and normalizing to the band of SsbB expression 10 min after BIP addition to R4509 as 1. α-σX and α-SsbB antibodies used as shown.
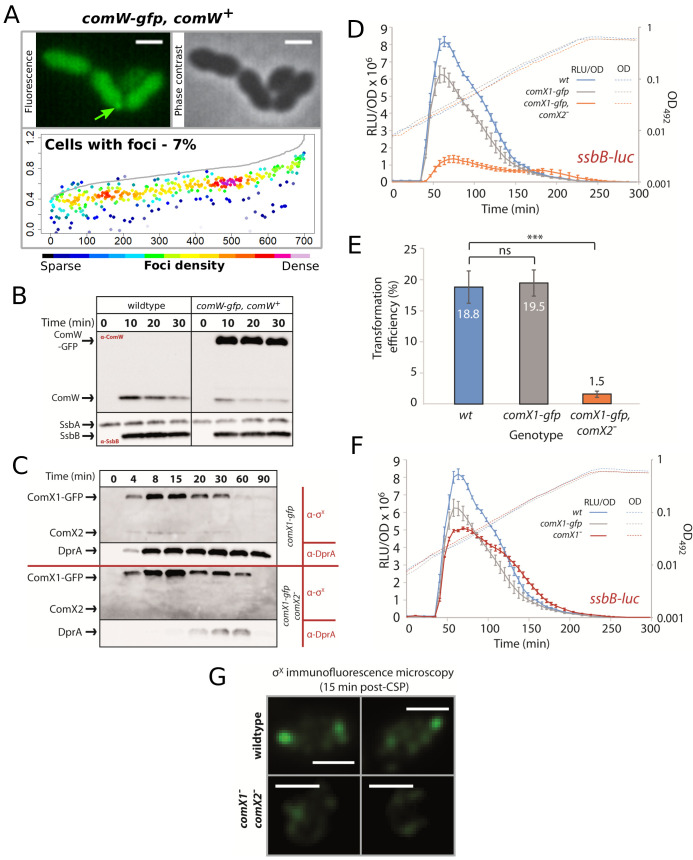
Figure 5—figure supplement 2. Validation of comW and comX fluorescent fusions.

Figure 5—figure supplement 2.

(A) ComW-GFP is diffuse within the cell cytoplasm. Localization of ComW-GFP in R4513 strain (comW-gfp, comW+) 15 min after competence induction. Sample fluorescence microscopy images shown. Scale bars, 2 µM. Focus density maps presented as in Figure 1E. 9705 cells and 701 foci analyzed. (B) Western blots showing expression of ComW, ComW-GFP, SsbA and SsbB in response to CSP addition to either R1501 (wildtype) or R4513 (comW-gfp, comW+) cells. α-ComW or α-SsbB antibodies used as shown. α-SsbB antibodies recognize both SsbA and SsbB. Samples at each time point corrected by OD to render direct comparison of cellular levels possible. (C) Western blots tracking cellular levels of σX, σX-GFP and DprA after competence induction in R4451 (comX1-gfp) and R4461 (comX1-gfp, comX2-) strains. α-σX and α-DprA antibodies used as shown. Samples at each time point corrected by OD to render direct comparison of cellular levels possible. (D) σX-GFP is partially active in competence induction. Comparing the competence profiles of R1502 (ssbB-luc), R4471 (comX1-gfp, ssbB-luc), and R4465 (comX1-gfp, comX2-, ssbB-luc) strains. Data presented as described in Figure 1—figure supplement 1D. Error bars represent triplicate repeats. (E) Comparing transformation efficiencies of R1501 (wildtype), R4451 (comX1-gfp), and R4461 (comX1-gfp, comX2-) strains. rpsL41 PCR fragment, conferring streptomycin via point mutation (Salles et al., 1992), used to transform at 50 ng mL−1. Error bars represent triplicate repeats. Statistical differences between wildtype and mutants determined by Student’s T-test using GraphPad Prism. p Values as followed compared to wildtype. comX1-gfp, 0.81; comX1-gfp comX2-, 0.0009. (F) σX-GFP is active in the shut-off of competence. Comparison of competence profiles of R1502 (ssbB-luc), R4471 (comX1-gfp, ssbB-luc), and R4466 (comX1- ssbB-luc) strains as described in Figure 1—figure supplement 1D. Comparison of data from panel E and Figure 7B. Error bars represent triplicate repeats. (G) Sample immunofluorescence microscopy images of a strain producing wildtype σX (R1501; wildtype) and a strain lacking σX (R4072; comX1-, comX2-) fixed 15 min after competence induction and probed using anti- σX antibodies. Scale bars, 1 µm.