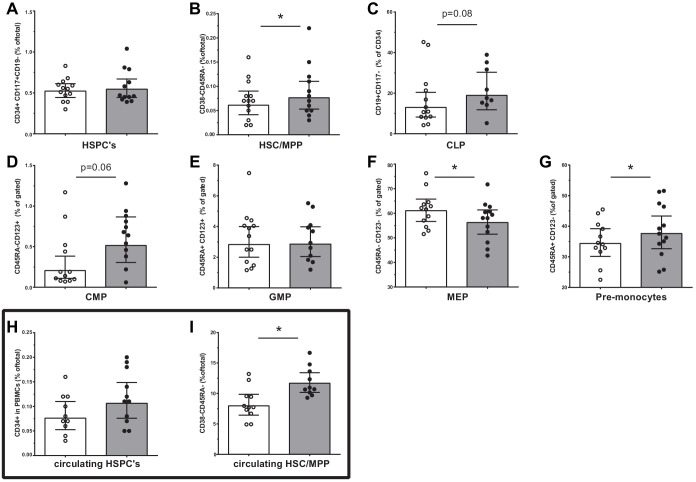
Figure 2. Progenitor cell populations in the bone marrow compartment (A–G) and in the circulation (H and I).
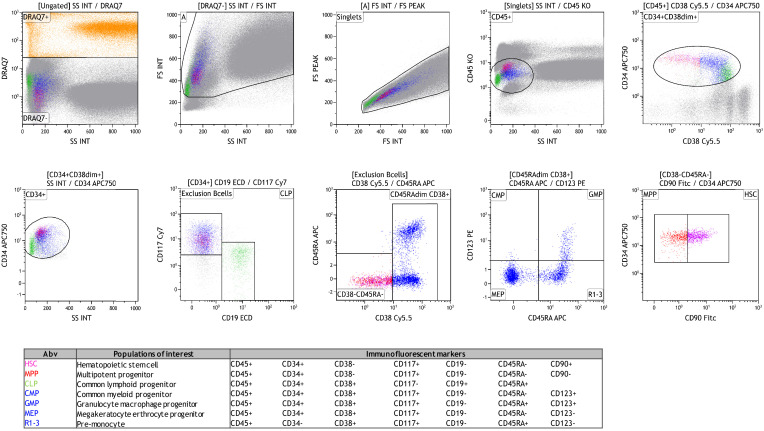
Control individuals (white bars, n = 13) and individuals with CAD (gray bars, n = 13). HSC and MPP cell populations were combined as the CD90 expression marker was not available for n = 6 in each study group. Geometric mean with 95% CI. The p-values are corrected for age and BMI with ANCOVA. * indicates p<0.05, **: p<0.01. In top-down order: HSC indicates hematopoietic stem cell, MPP: multipotent progenitor, CLP: common lymphoid progenitor, CMP: common myeloid progenitor, GMP: granulocyte-macrophage progenitor, MEP: megakaryocyte erythrocyte progenitor.


