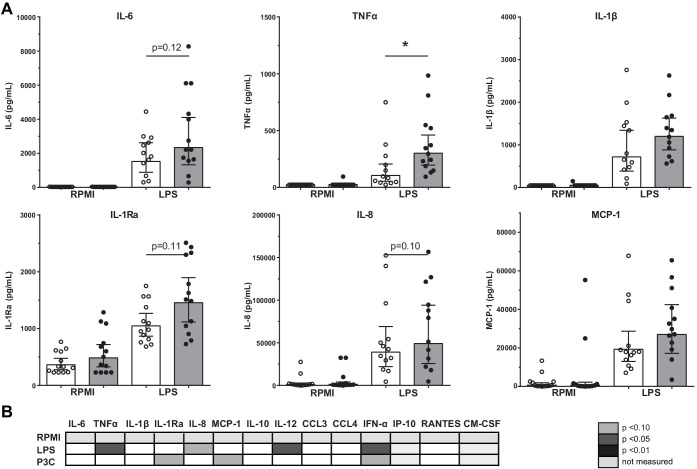
Figure 3. Cytokine production capacity of bone marrow MNCs.
(A) Cytokine production capacity of BM-MNCs after LPS stimulation in control individuals (white bars, n = 13) and individuals with CAD (gray bars, n = 13). Geometric mean with 95% CI. (B) Table of cytokine/chemokine production (x-axis) after stimulation with LPS or P3C (y-axis) of BM-MNCs showing statistical differences between groups. The p-values are corrected for age and BMI with ANCOVA. Outliers were removed with an SD of >2.5 of Z-scores. * indicates p<0.05, **: p<0.01.

