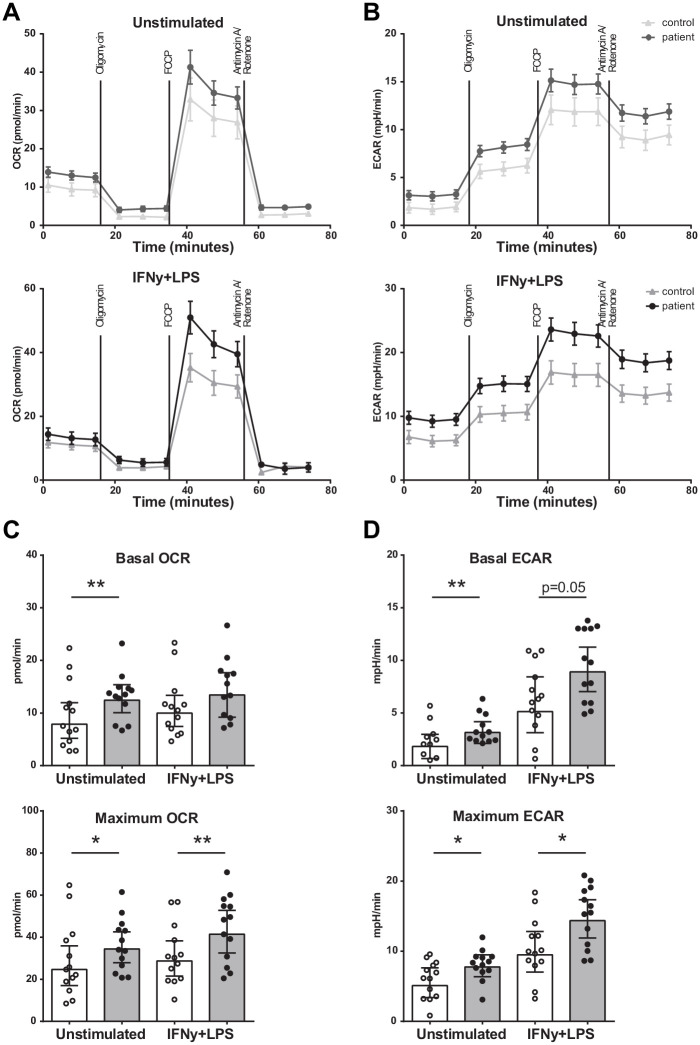
Figure 4. Metabolism of BM-MNCs assessed with Seahorse respirometry in unstimulated condition and 2 hours after IFN-γ+LPS stimulation.
(A, B) Oxygen consumption and extracellular acidification rates over time using treatment with Oligomycin, FCCP, and Rotenone/Antimycin A. (C, D) Bar graphs of control individuals (white bars, n = 13) and individuals with CAD (gray bars, n = 13). Geometric mean with 95% CI. The p-values are corrected for age and BMI with ANCOVA. * indicates p<0.05, **: p<0.01. IFN-γ+LPS: 2 hr IFN-γ and LPS stimulation.

