. 2020 Nov 10;9:e60939. doi: 10.7554/eLife.60939

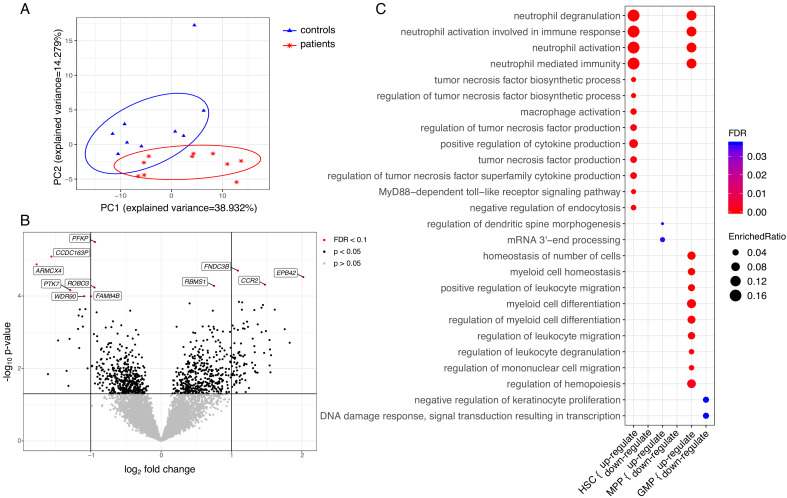
Figure 6. Transcriptome analyses of HSC, MPP, and GMP populations.

Control individuals (n = 10) versus individuals with CAD (n = 10) for each cell population. (A) Principle component analysis (PCA) based on differentially expressed (DE) genes of the HSC population; (B) Volcano plot showing differential expressed genes between patients with CAD and individuals without atherosclerosis, controlled for age, in a combined analysis of HSC, MPP, and GMP population. Genes with an FDR <0.1 are named; (C) Gene ontology enrichment analysis of DE genes from HSCs, MPPs, and GMPs, depicting the FDR and enrichment ratio.

Figure 6—source data 1. Contains source data for Figure 6B, and Figure 6—figure supplements 1B, 2, 3.
Table of differential expressed genes between patients with CAD and individualswithout atherosclerosis, controlled for age, in a combined/separated analysis of HSCs, MPPs, and GMPs population.
elife-60939-fig6-data1.xlsx (148.9KB, xlsx)
Figure 6—source data 2. Contains source data for Figure 6C.
Table of enrichment analysis of gene ontology terms and involved DE genes of HSCs, MPPs, and GMPs population.

Figure 6.

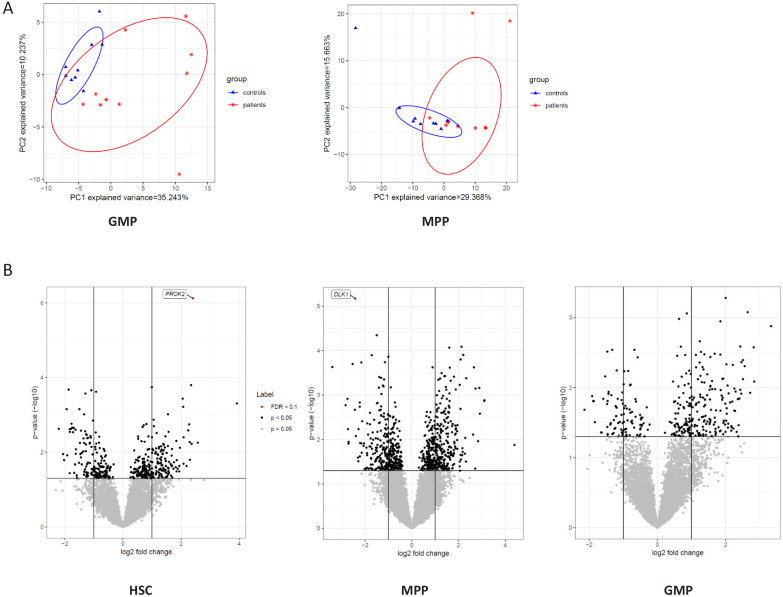
Figure 6—figure supplement 1. Transcriptome of HSC, MPP, and GMP populations.

Figure 6—figure supplement 1.

(A) PCA analysis based on DE genes of the GMP and MPP cell population; (B) Volcano plot showing differential expressed genes between CAD patients and controls, controlled for age, in the HSC, MPP, and GMP cell populations. Genes with an FDR <0.1 are called out.
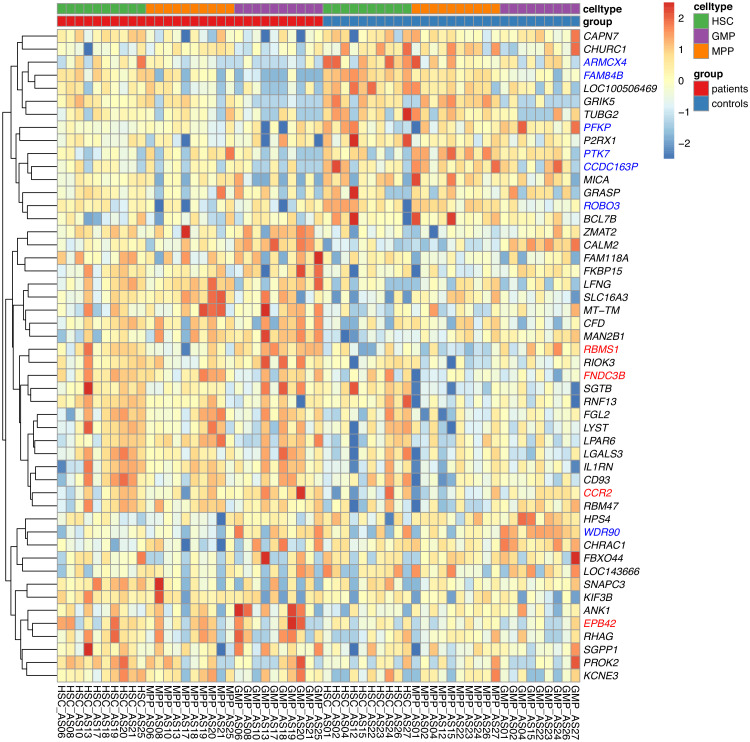
Figure 6—figure supplement 2. Combined heatmap showing the top 50 DE genes for the HSC, MPP, and GMP cell populations in the patients and the control subjects.

Figure 6—figure supplement 2.

Genes with an FDR <0.1 are colored in red and blue for up- and down-regulated, respectively.
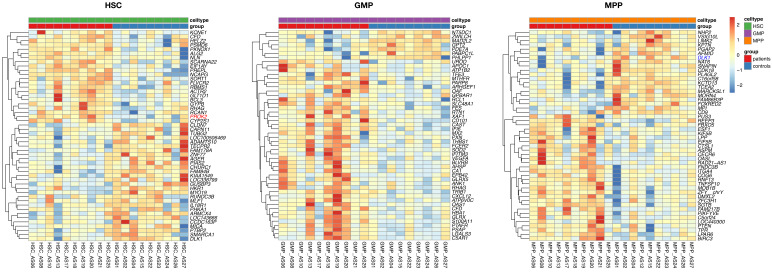
Figure 6—figure supplement 3. Separated heatmap showing the top 50 DE genes for each of the HSC, MPP, and GMP cell populations in the patients and the control subjects.

Figure 6—figure supplement 3.

Genes with an FDR <0.1 are colored in red and blue for up- and down-regulated, respectively.