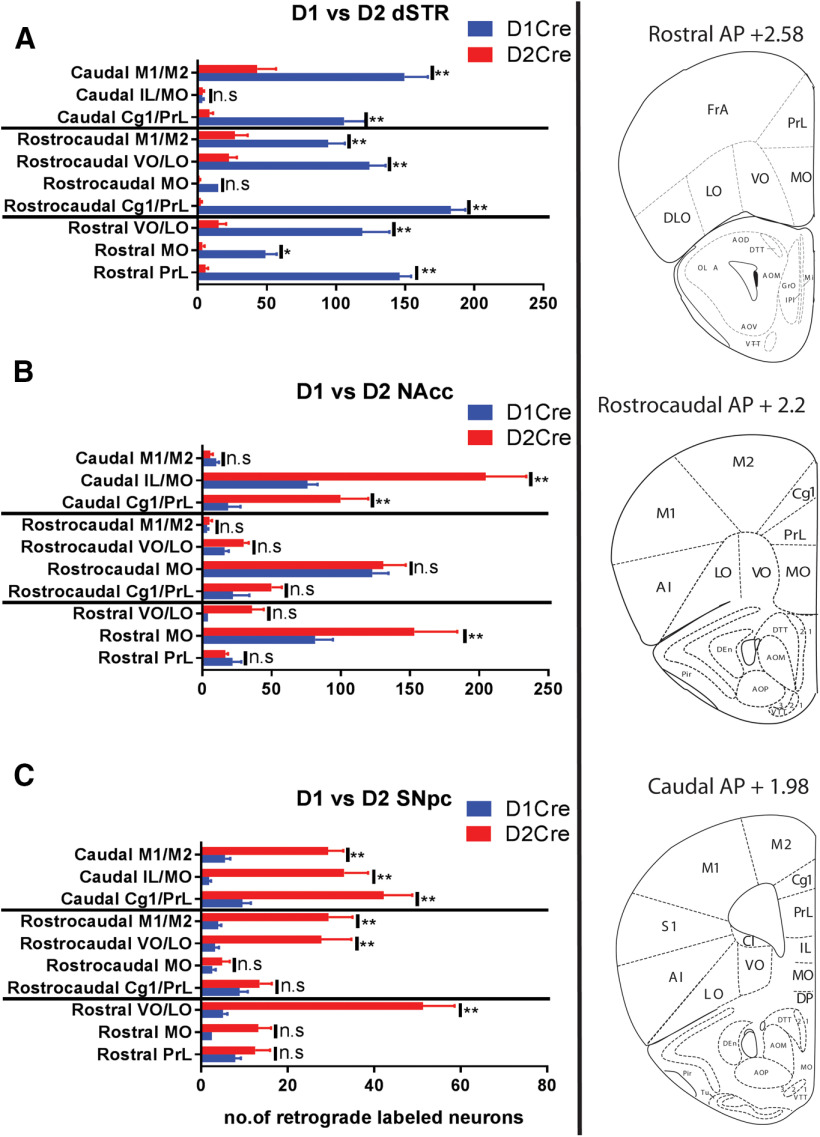
Figure 3.
Comparison of topographical distribution of D1R+ and D2R+ PFC neurons along the rostrocaudal axis. A, Quantification of GFP+ (dSTR) cells in PFC sections along the rostrocaudal axis of D1Cre and D2Cre mice. Right panel, Representative images and stereotaxic coordinates of rostral, rostrocaudal, and caudal PFC sections. B, Quantification of TdT+ (NAcc core) cells in PFC sections along the rostrocaudal axis of D1Cre and D2Cre mice. C, Quantification of TdT+ (SNpc) cells in PFC sections along the rostrocaudal axis of D1Cre and D2Cre mice. PrL, prelimbic; Cg1, anterior cingulate; MO, medial orbitofrontal; VO, ventral orbitofrontal; LO, lateral orbitofrontal; AI, agranular insular; M1, primary motor; M2, secondary motor cortex; n = 5 for each group; n.s., not significant. Data are represented as mean ± SEM; *p < 0.05, **p < 0.01, two-way ANOVA.

