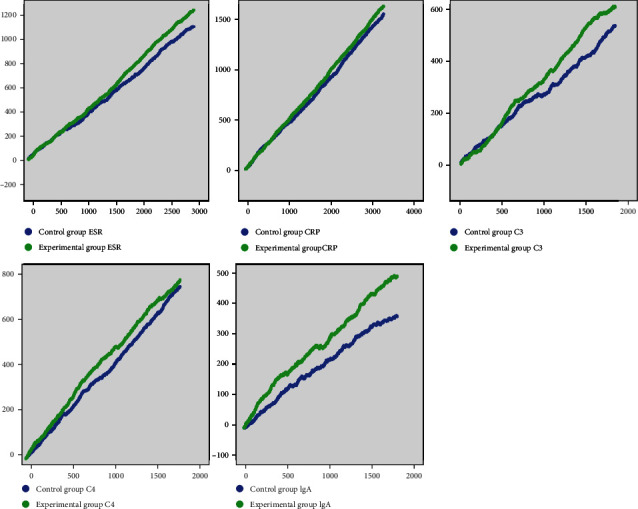
Figure 4.

Random walking model of immune-inflammatory indices in RA patients. Note: green line represents the experimental group. Blue line represents the control group. Length of horizontal line increases with the number of walking steps. Height of vertical line increases with intervention efficacy and response.
