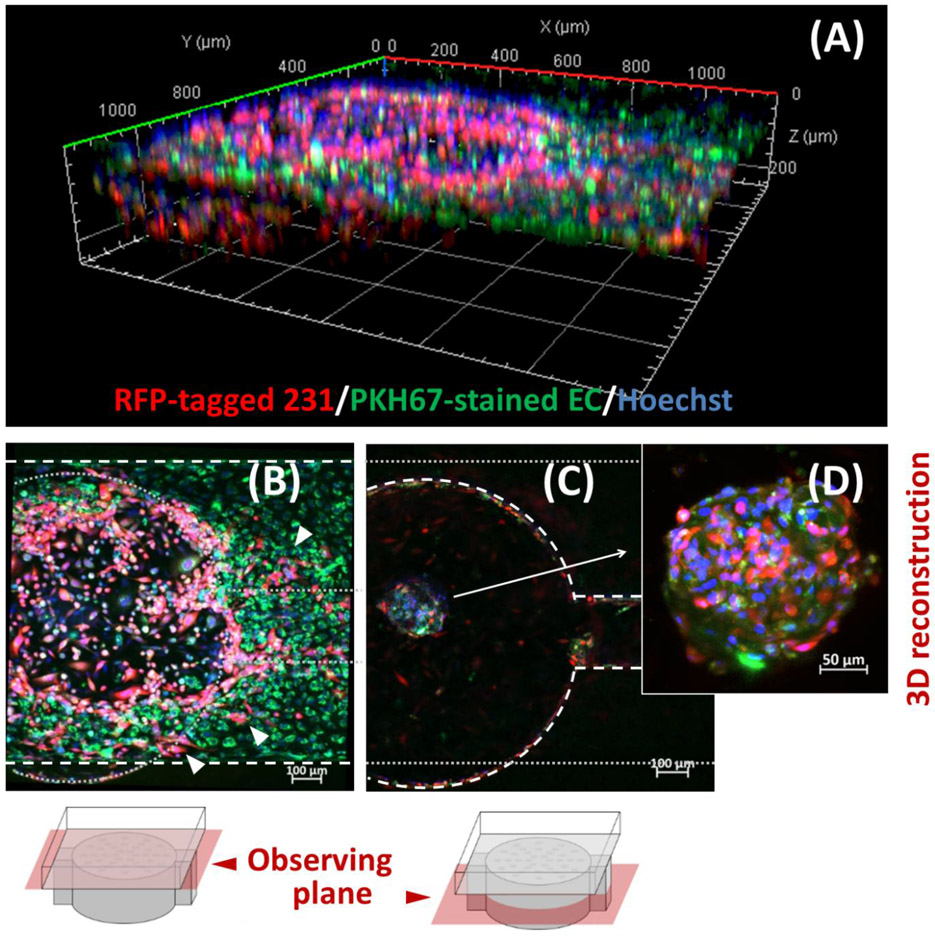
Figure 3.
Cell migration patterns of MDA-MB-231 and HMVEC at day 7 post-seeding. (A) Representative 3D-reconstructed image of one chamber in L-TumorChip obtained from Z-axis sliced confocal images (B) Representative image taken with focal plane at top channel Arrows indicate the migrated RFP-expressing breast cancer cells having invaded the green fluorescent endothelial barrier at the top channel. White dashed oulines indicate the outline of channel in the observing plane and gray round dots depict the outline of bottom chamber in an out-of-view plane. (C) Representative image taken with focal plane at bottom chamber. The white dashed oulines here indicate the bottom chamber in the observing plane and gray round dots depict the outline of the channel in an out-of-view plane. (D) Representative 3D-reconstructed image of the self-assemble MDA-MB-231/HMVEC spheriod. RFP-expressing MDA-MB-231 and PKH67-stained green HMVEC cells were initially seeded separately in the bottom chamber and the top channel, respectively.

