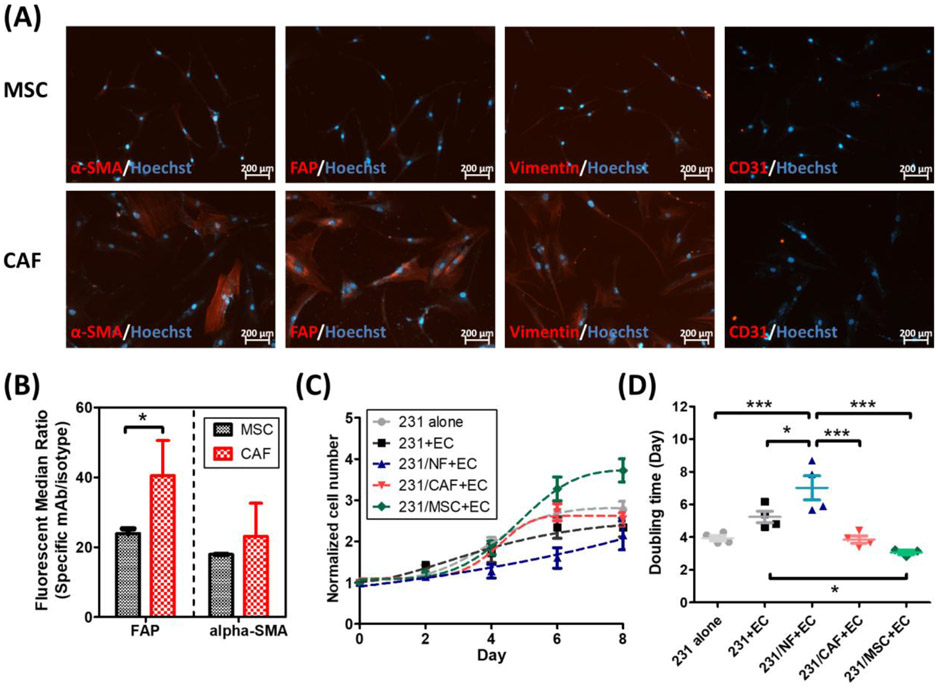
Figure 4.
Characterizations of MSC-derived CAF and its influence on cancer cell growth when cocultured in L-TumorChip. (A) Representative images of differentiated cells stained with the CAF-specific biomarkers (CD31 used as a negative control here). (B) Flow cytometry analysis on FAP/α-SMA expressions in MSC and the derived CAF. Results are represented as average ± S.D. (n = 3). Significance was determined using Student t-test (*, p < 0.05). (C) The proliferation and (D) doubling time of GFP-expressing MDA-MB-231 under different tumor microenvironment conditions in the device. Results are represented as average ± S.D. (n = 4). Significance was determined using one-way ANOVA and Tukey’s Multiple Comparison Test (*, p < 0.05; ***, p < 0.001).

