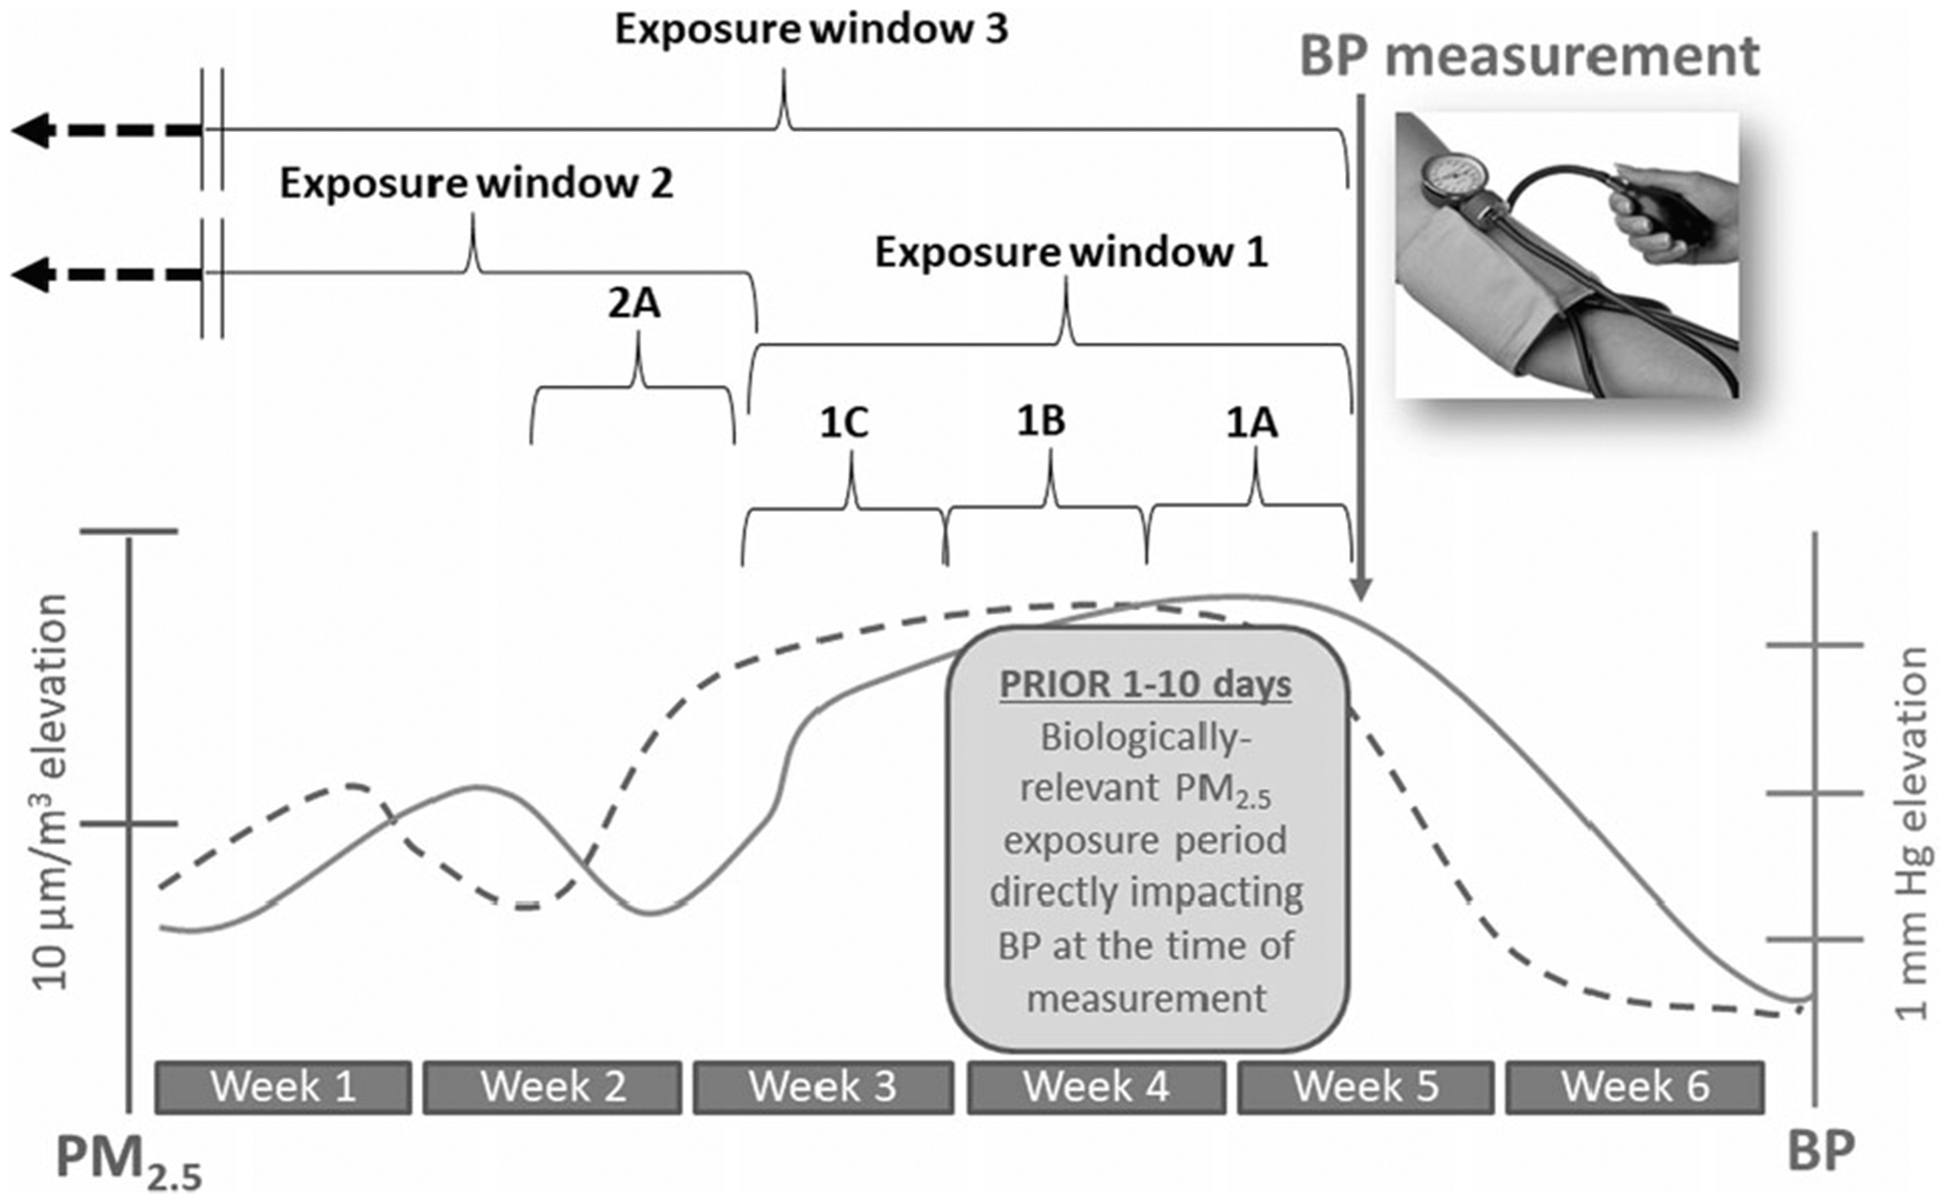
Fig. 3. Temporal relationships between fine particulate matter air pollution exposures and blood pressure changes.

BP increases starting 1 day after higher 24-h long PM2.5 exposures and persists elevated for a few (2–14?) days afterward. BP will remain higher for as long as PM2.5 remains elevated but will start to decrease within 1 (to a few) days after a reduction in PM2.5 levels occur. This occurs at all background levels of PM2.5; therefore, what is illustrated is the increase in systolic BP per increase in PM2.5 over set periods of time. Exposure window 1 captures the “biologically-operative” exposure-response relationship. Exposures during windows 1A and 1B directly play a causal role in changing the BP level at the time of measurement and therefore they accurately predict BP. Window 1C predicts BP simply because the PM2.5 levels are strongly correlated with (and did not change from) windows 1A and 1B. Exposure window 2 represents PM2.5 levels that occurred in a time that is remote from the biologically-operative period. Exposures in this window are biologically unrelated to the BP during the measurement time. If they show a statistical association with BP, it is only because the exposure (i.e., window 2A) is stable and/or highly-correlated to the exposure during window 1. Exposure window 3 represents the chronic period. This includes the biologically-operative period but also exposures that occurred from weeks to months or years earlier. Including longer periods in the average exposure therefore involves many exposure windows that are not biologically relevant (i.e., play no role in determining BP level at the point of measurement). Exposure window 3 may not be predictive of BP because the predominant period of the time that is averaged includes window 2 (and could be months in duration and therefore determines the average level), which is not biologically relevant in relation to the measured BP. Therefore, simply averaging longer exposure periods may produce a more stable chronic exposure estimate but also it produces a worse estimation of the actual “operatively relevant exposure” period (window 1) and can yield a falsely null association with BP levels at the time of measurement. Window 3 might predict BP as a statistical artifact because it might be correlated with the PM2.5 levels during window 1. In comparisons between study locations on a spatial dimension, window 3 might predict BP between sites because they are arranged in an ordinal manner whereby they correlate with exposures during window 1 across sites. In this example, window 3 and 1 are not correlated, and therefore window 3 is not associated with BP.
