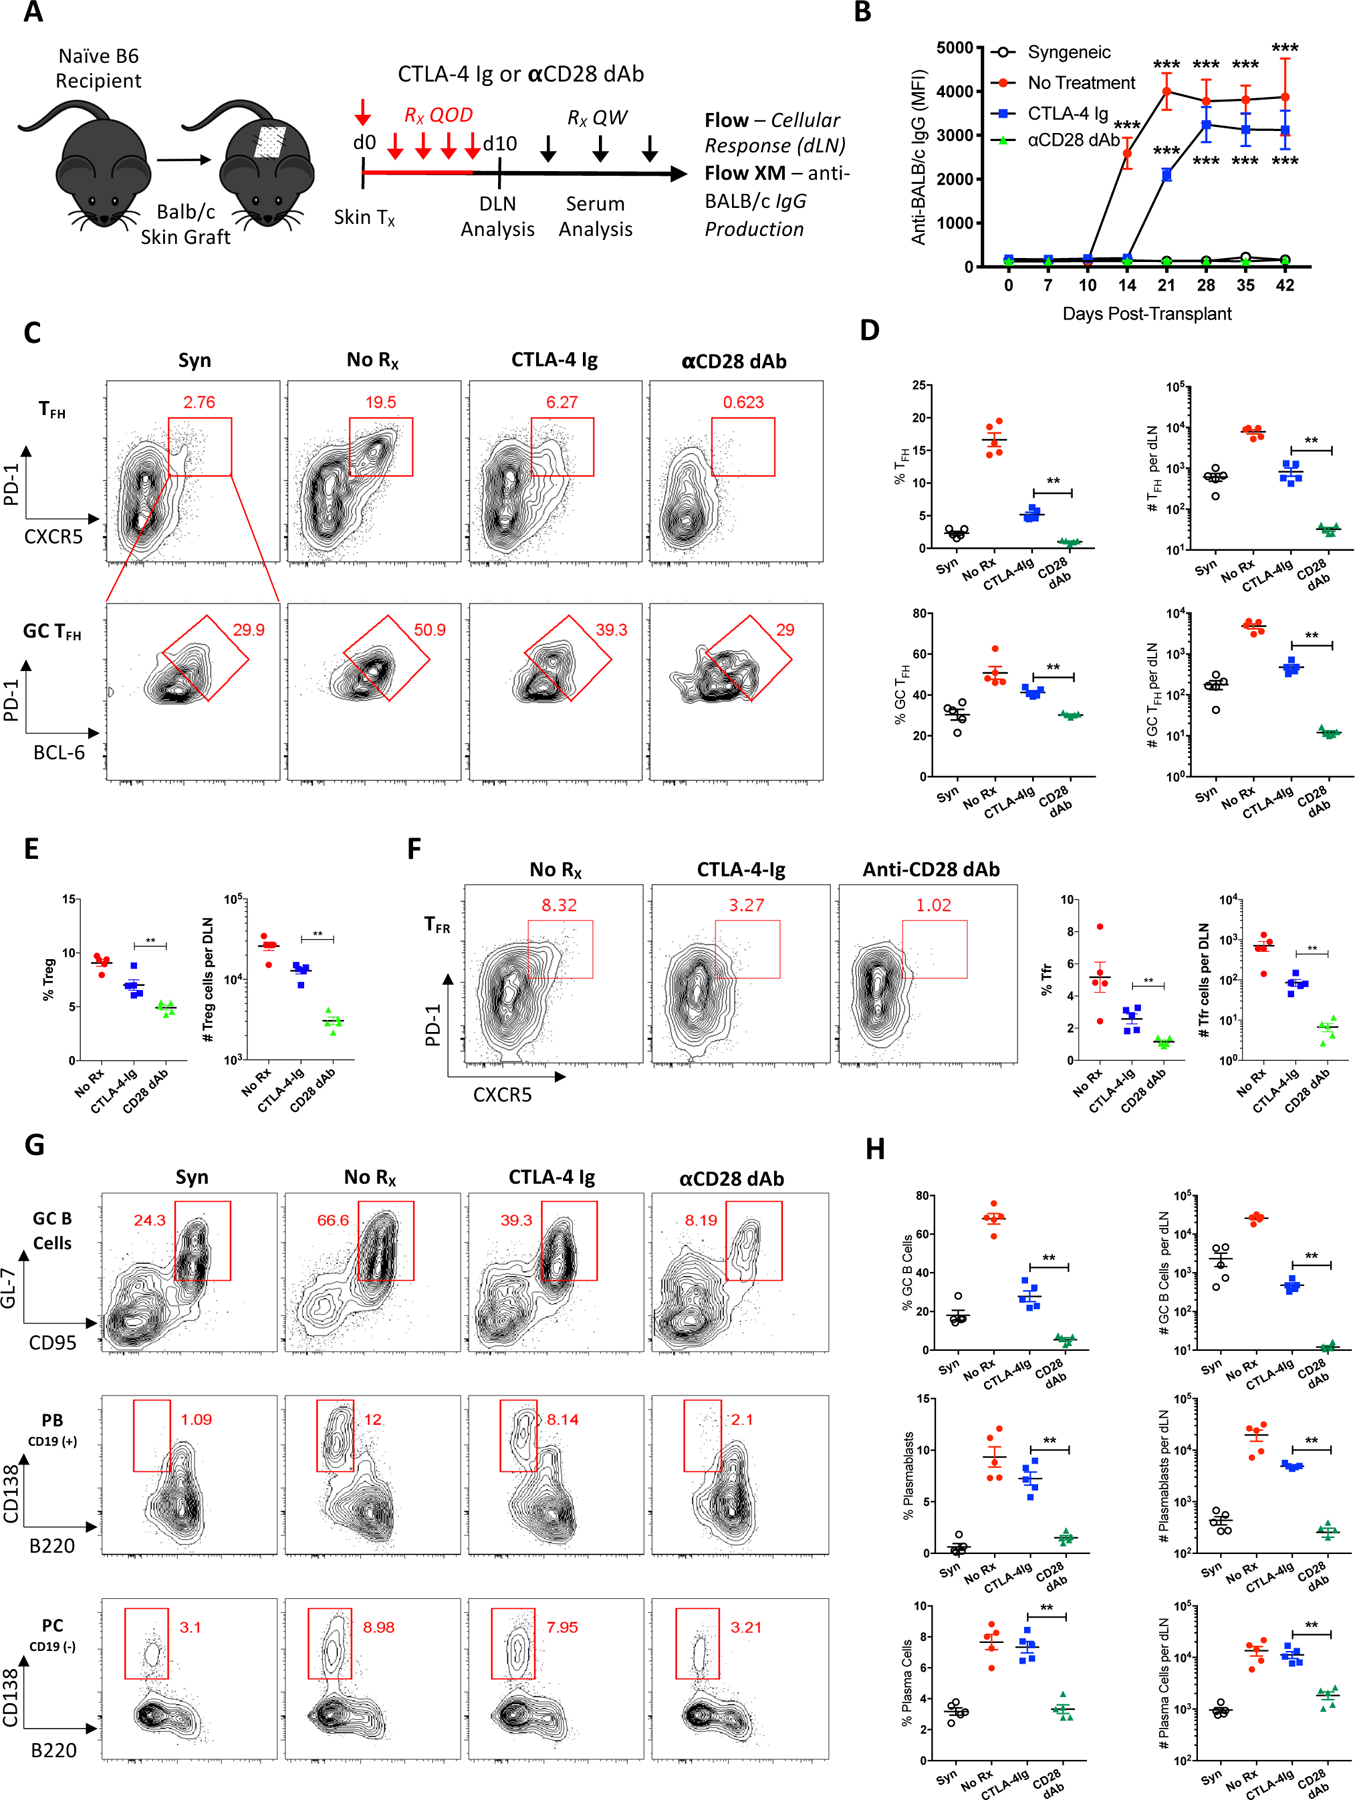
Figure 1. Selective CD28 blockade exhibits superior inhibition of antibody responses compared to CTLA-4-Ig.

(A) Naïve B6 mice were transplanted with skin from syngeneic (B6) or allogeneic (BALB/c) donors and sacrificed 10 days post-transplant for graft-DLN analysis or serially bled for serum analysis. Transplanted mice were left untreated, or treated with either CTLA-4-Ig or anti-CD28 dAb every other day (QOD, red) the first week and then weekly (QW, black) thereafter. (B) Summary data of anti-donor total serum IgG over time (n=5 per group). (C) Representative flow cytometric plots displaying the frequencies of DLN Tfh (CXCR5+PD-1hi, gated on CD4+CD44hiFoxp3− T cells) and GC Tfh (Bcl6hiPD-1hi+, gated on CXCR5+PD-1hi Tfh cells) cells under each treatment condition. (D) Summary data of the frequencies and numbers of Tfh and GC Tfh cells (n=5 per group). (E) Summary data of the frequencies and numbers of Treg (CD4+Foxp3+CD25+) cells (n=5 per group). (F) Representative flow plots and summary data of the frequencies and numbers of Tfr (CXCR5+PD-1hi, gated on CD4+CD44hiFoxp3+ T cells) cells. (G) Representative flow plots displaying the frequencies of DLN GC B cells (GL7+CD95+, gated on IgD−CD19+B220+CD138− B cells), plasmablasts (B220−CD138+, gated on IgD−CD19+ B cells), and plasma cells (B220−CD138+, gated on IgD−CD19− B cells). (H) Summary data of the frequencies and numbers of GC B cells, plasmablasts, and plasma cells (n=5 per group). Summary data represent mean (SE) and are representative of at least 2 independent experiments with a total of at least 10 mice per group. **p < 0.01, ***p< 0.001.
