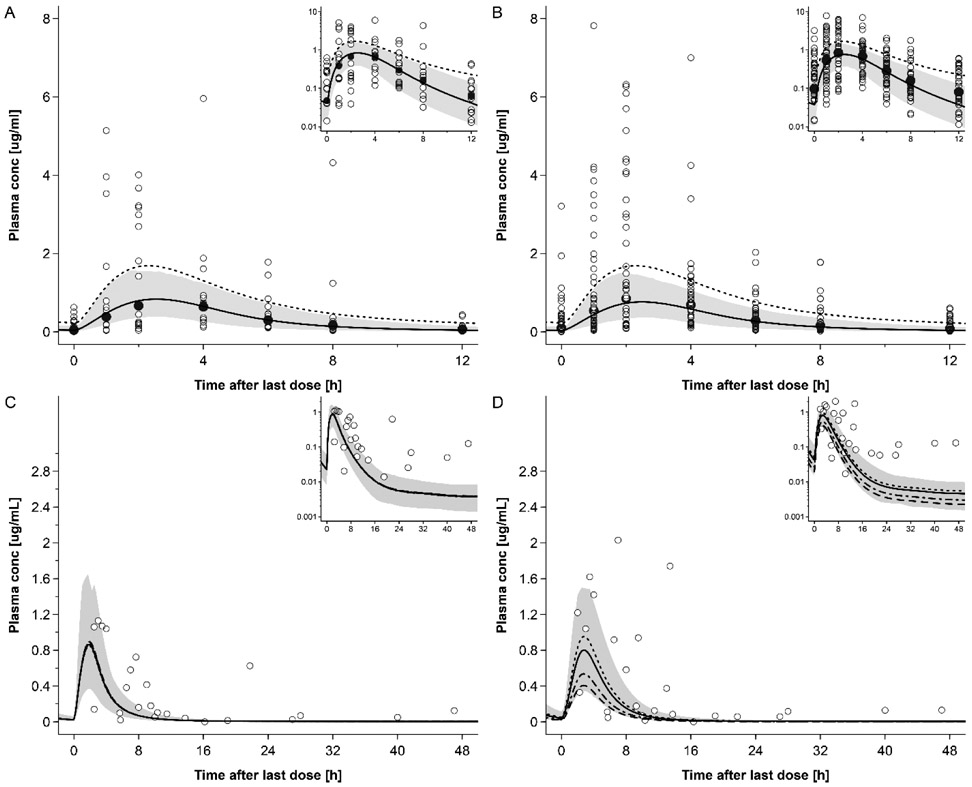
Figure 5:
Plasma concentration-time profiles of raltegravir following oral administration of 400 mg twice a day in pregnant women in steady state. Semi-log scale figures are given as inset figure in the top right corners. Observed steady-state in vivo data were taken from in vivo study of IMPAACT P1026.[30] A: raltegravir 400 mg twice a day in pregnant women in 2nd trimester. Empty circles represent individual concentrations taken from in vivo study of IMPAACT P1026. [30] Black circles represent geometric mean concentrations taken from in vivo study of IMPAACT P1026. [30] The solid line represents the predicted mean concentration and the shaded area the predicted 5th – 95th percentile range; The dotted line represents the predicted mean concentration of non-pregnant population; B: raltegravir 400 mg twice a day in pregnant women in 3rd trimester. Empty circles represent individual concentrations taken from in vivo study of IMPAACT P1026. [30] The solid line represents the predicted mean concentration and the shaded area the predicted 5th – 95th percentile range; The dotted line represents the predicted mean concentration of non-pregnant population; C: raltegravir 400 mg twice a day in pregnant women with an average gestational age of 38 weeks at delivery. Empty circles represent individual concentration data in the maternal plasma taken from in vivo study of IMPAACT P1026; [30] the lines represent the predicted mean concentrations in the maternal plasma using different partition coefficients calculated by different methods.; The solid line represents the QSAR method; The dotted line represents Poulin and Theil method; The dash-dot line represents the Rodgers and Rowland method; The dash line represents the PK-sim standard method. The shaded area represents the predicted 5th – 95th percentile range of the prediction by using QSAR method. D: raltegravir 400 mg twice a day in pregnant women with an average gestational age of 38 weeks at delivery. Empty circles represent individual concentration data in the umbilical vein taken from in vivo study of IMPAACT P1026; [30] the lines represent the predicted mean concentrations in the umbilical vein using different partition coefficients calculated by different methods: the solid line represents the QSAR method; the dotted line represents Poulin and Theil method; the dash-dot line represents the Rodgers and Rowland method; and the dash line represents the PK-sim standard method. The shaded area represents the predicted 5th – 95th percentile range of the prediction by using QSAR method.

