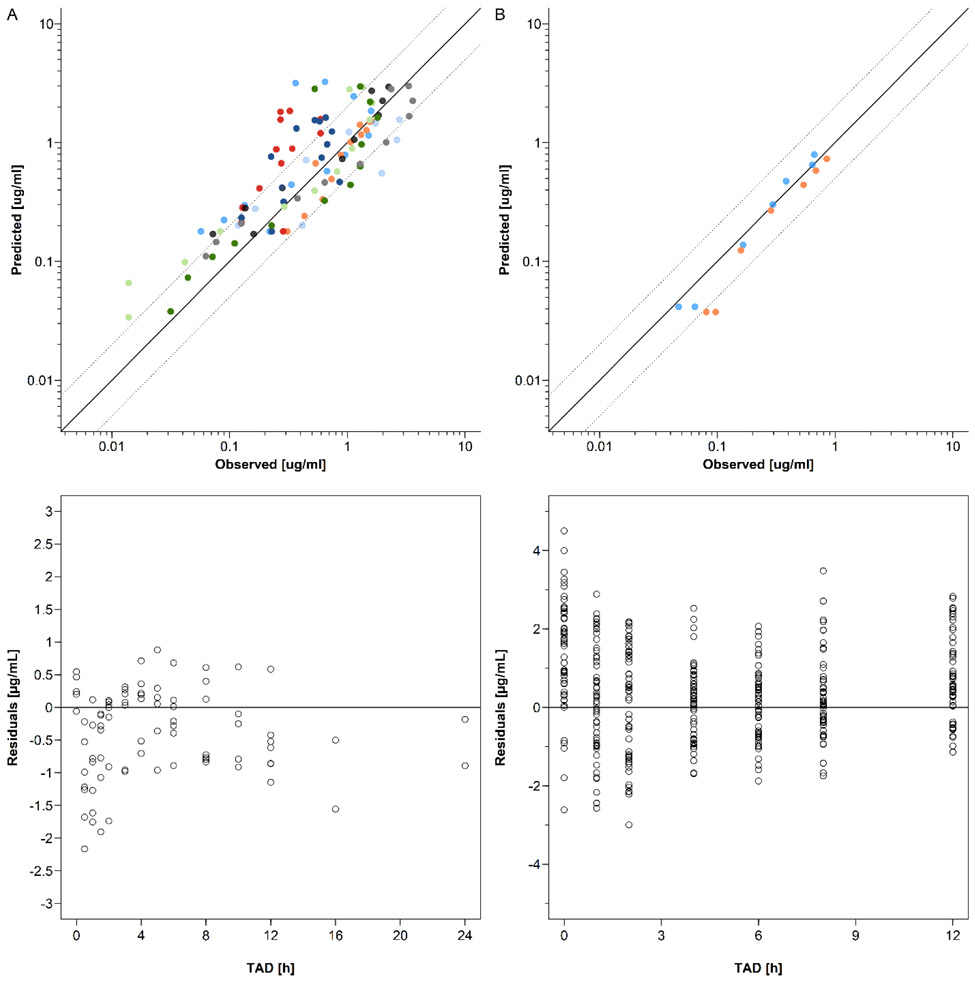
Figure 6:
Goodness-of-fit and residuals vs time plots of raltegravir concentrations in non-pregnant subjects (A) and pregnant women (B). The solid line represents the line of identity and the dotted lines the 2-fold error range. A panel: Upper plot: GOF plot of geometric mean dolutegravir concentrations in non-pregnant populations. single dose study: bright green circles indicate the study by Iwamoto et al. (400mg single dose) [78]; dark green circles indicate the study by Rhee et al. (400mg single dose) [76]; grey circles indicate the study by Wenning et al. (400mg single dose) [77]. multiple dose study: blue circles indicate the fasted group in the study by Brainard et al. (400mg multiple dose) [79]; orange circles indicate the high fat group in the study by Brainard et al. (400mg multiple dose)[79]; dark blue circles indicate high moderate fat group in the study by Brainard et al. (400mg multiple dose) [79]; red circles indicate the low fat group in the study by Brainard et al. (400mg multiple dose) [79]; black circles indicate the study by Markowitz et al. (400mg multiple dose) [75]. sky blue circles indicate the group 1 in the study by Taburet et al. (400mg multiple dose) [80]; light blue circles indicate the group 2 in the study by Taburet et al. (400mg multiple dose) [80]; B panel: Upper plot: GOF plot of raltegravir in pregnant population. blue circles indicate geometric mean concentrations in women in the 2nd trimester; orange circles indicate geometric mean concentrations in women in the 3rd trimester. Lower plot: residuals vs time plot of raltegravir in pregnant population. Empty circles represent the individual concentrations in 2nd and 3rd trimesters.

