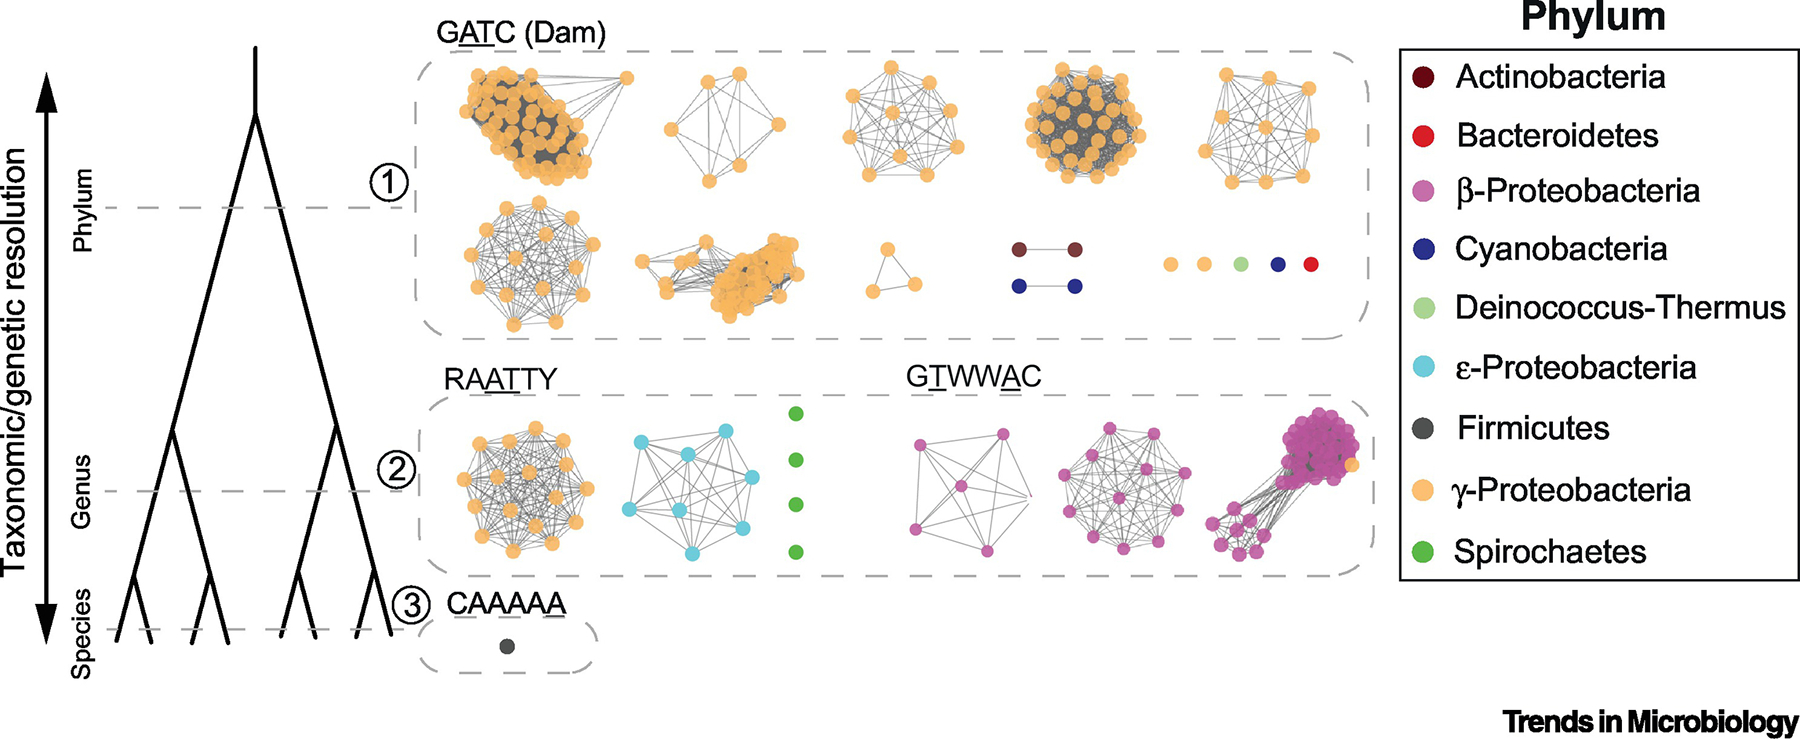
Figure 3.

Illustrative examples of sequence similarity networks of persistent MTases conserved at different taxonomic resolutions (Supplementary Table 5). Each node represents one protein. To avoid redundancy and improve visualization, only one genome per species is shown (typically the reference/representative genome). Edges correspond to pairwise protein sequence identity >60%. Node colors correspond to different phyla.
