
Figure 4: Histograms of local percent scale factor change in two ex-vivo to histology mappings and two in-vivo to ex-vivo mappings.
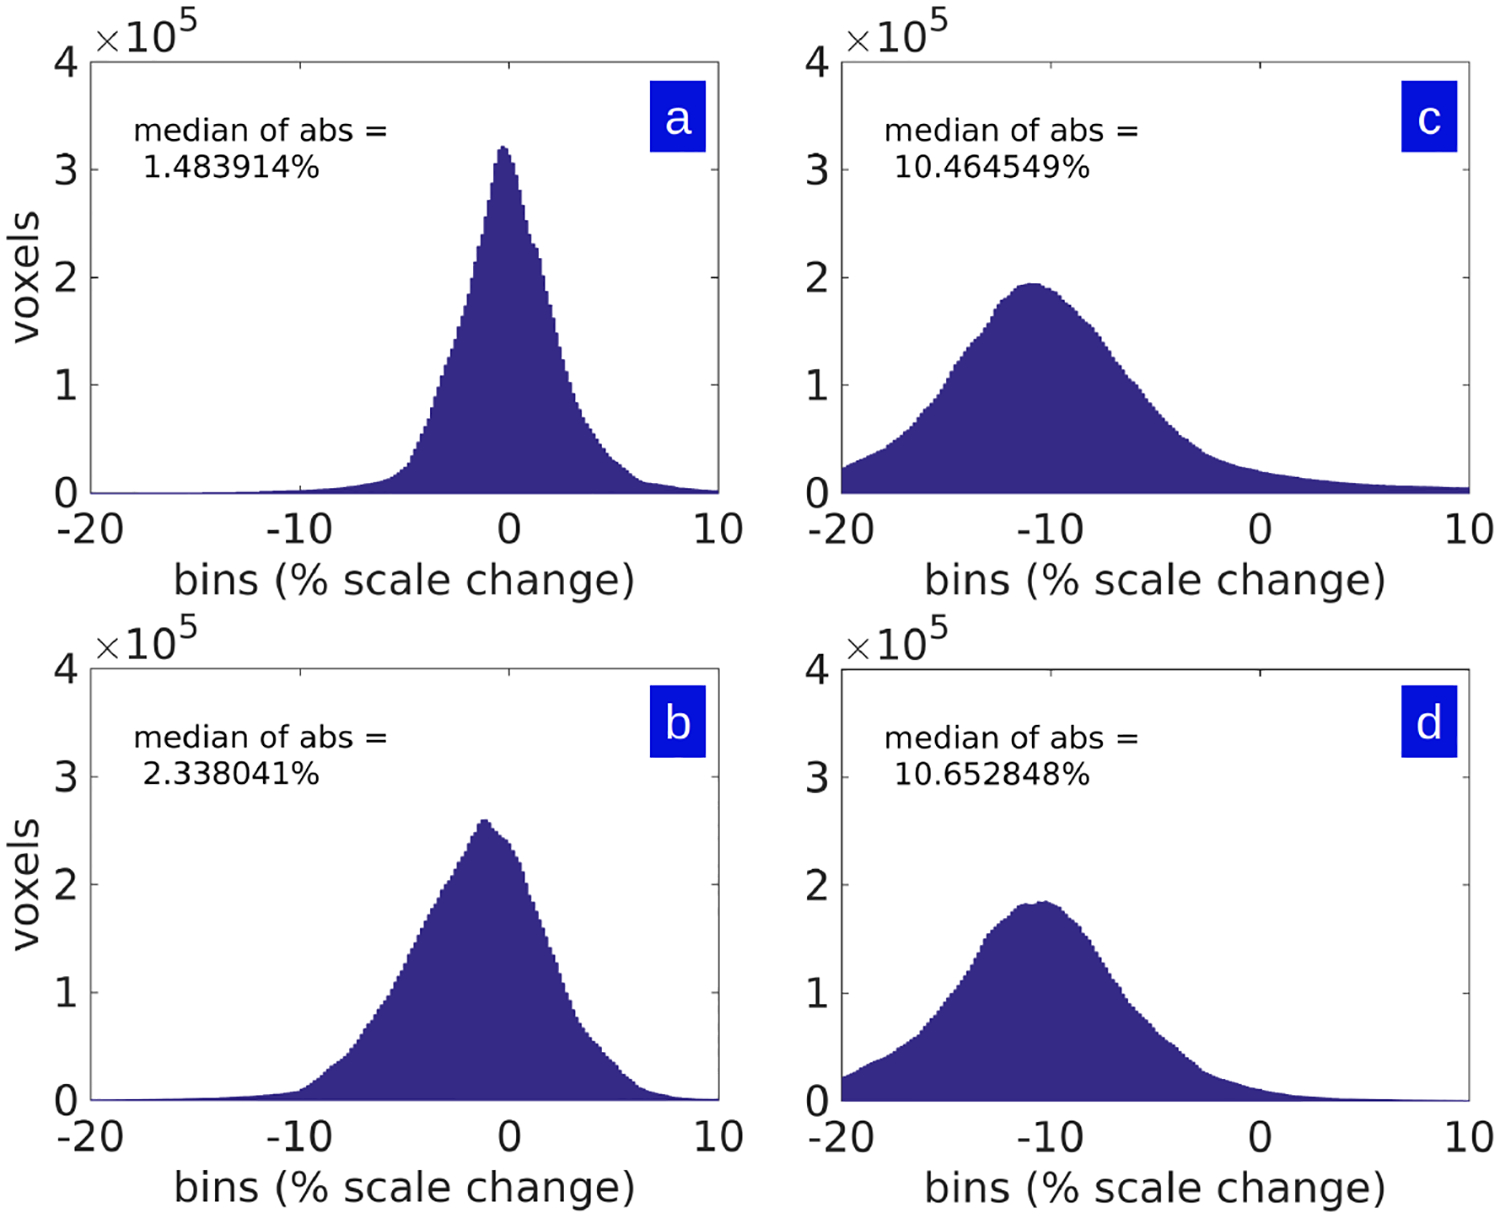
Shown are histograms of the percent scale in single axis dimension as measured by cube-root of Jacobian determinant of maps shown in Fig 3. Panels A and B show the ex-vivo MRI mapped to Nissl histological stack; Panels C and D show the ex-vivo MRI to in-vivo MRI histograms.